


ServiceNow Statistics 2026: Revenue, Market Share, Customers & Employee Base, Acquisitions & More
source on Google

Table of Contents
source on Google
ServiceNow, founded in 2004 by Fred Luddy with a single laptop, has been recognized among the world’s most innovative and admired companies.
ServiceNow, a cloud-based platform has a robust ecosystem of applications for IT Service & operation management, customer service management, security operations, field service management, and more.
From its humble beginning to its rapid growth and widespread adoption, in this guide, we will shed light on the ServiceNow statistics that tell the story of ServiceNow’s success.
ServiceNow Revenue
The continuous expansion of ServiceNow products and services in the CRM landscape and AI capabilities resulted in significant growth in revenue.
Here we have compiled ServiceNow’s annual revenue from 2022 to 2026 (Q1):
ServiceNow Revenue 2026
ServiceNow’s Q1 2026 revenue totaled $3,770M for the quarter ended March 31, 2026, highlighting 22% year-over-year (YoY) growth. Subscription revenue led the quarter at $3,671M, continuing the double-digit growth driven by accelerating AI adoption.
Here is the breakdown of ServiceNow revenue for Q1 2026:
| Q1 2026 financial results | |
|---|---|
| Subscription revenue | $3,671M |
| Professional services and other revenue | $99M |
| Total revenue | $3,770M |
Key Business Highlights: Q1 2026
Now Assist Momentum: Now Assist customers spending over $1 million in annual contract value grew over 130% year-over-year.
Large Deal Growth: ServiceNow closed 16 transactions over $5 million in net new annual contract value (ACV) in Q1 2026, highlighting nearly 80% year-over-year growth.
Forward Pipeline: Servicenow’s current remaining performance obligations (cRPO) reached $12.64 billion as of Q1 2026, representing 22.5% year-over-year growth, signaling strong contracted future revenue.
Strategic Acquisition: ServiceNow closed its acquisition of Armis on April 20, 2026, combining Armis’ real-time asset discovery and cyber exposure management with ServiceNow’s AI Control Tower. It also closed its acquisition of Veza on March 2, 2026, extending security capabilities to give enterprises complete visibility and control over who and what can access critical data, applications, and AI agents.
ServiceNow Revenue 2025
ServiceNow’s annual revenue in 2025 totaled $13.28B, representing 20.8% growth compared to the previous year’s $10.99B revenue.
Here is the breakdown of ServiceNow revenue by each quarter:
| Q1 2025 financial results | |
|---|---|
| Subscription revenues | $3,005M |
| Professional services and other revenue | $83M |
| Total revenue | $3,088M |
| Q2 2025 financial results | |
|---|---|
| Subscription revenues | $3,113M |
| Professional services and other revenue | $102M |
| Total revenue | $3,215M |
| Q3 2025 financial results | |
|---|---|
| Subscription revenues | $3,299M |
| Professional services and other revenue | $108M |
| Total revenue | $3,407M |
| Q4 2025 financial results | |
|---|---|
| Subscription revenues | $3,466M |
| Professional services and other revenue | $102M |
| Total revenue | $3,568M |
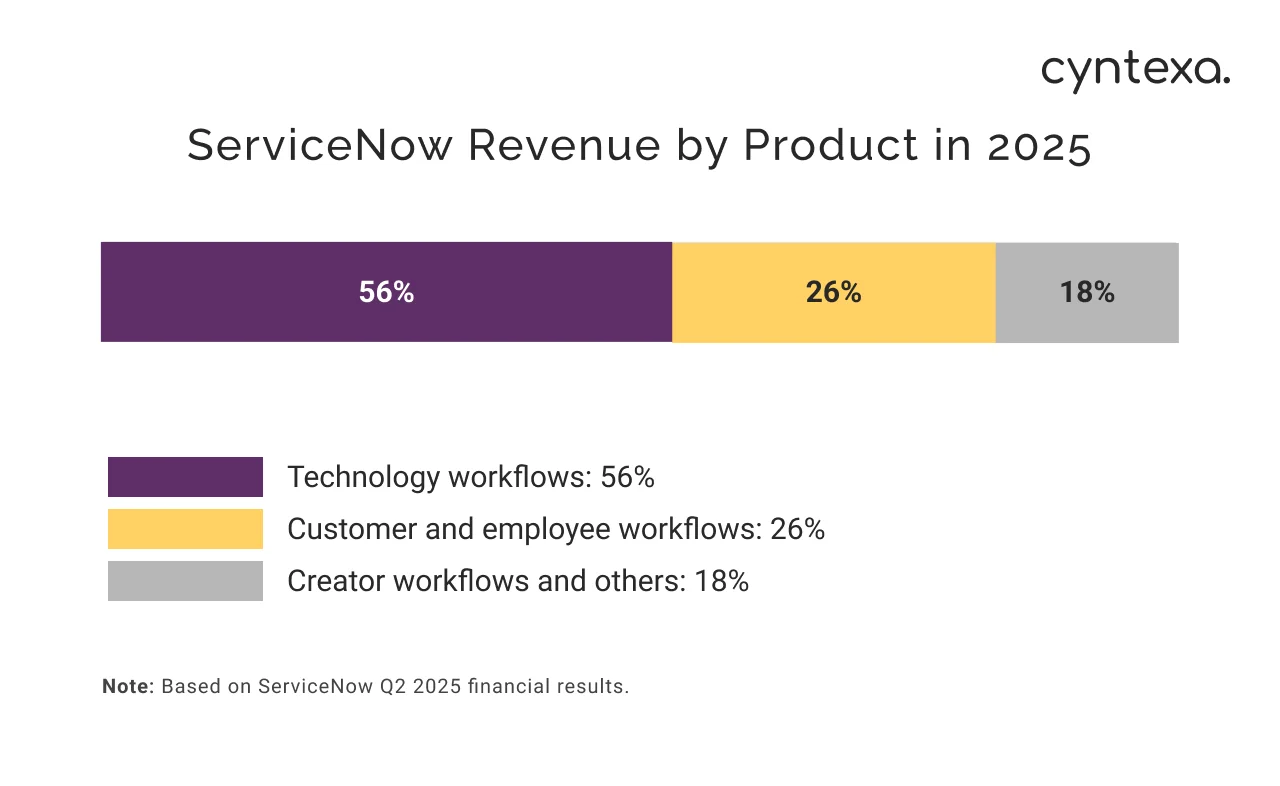
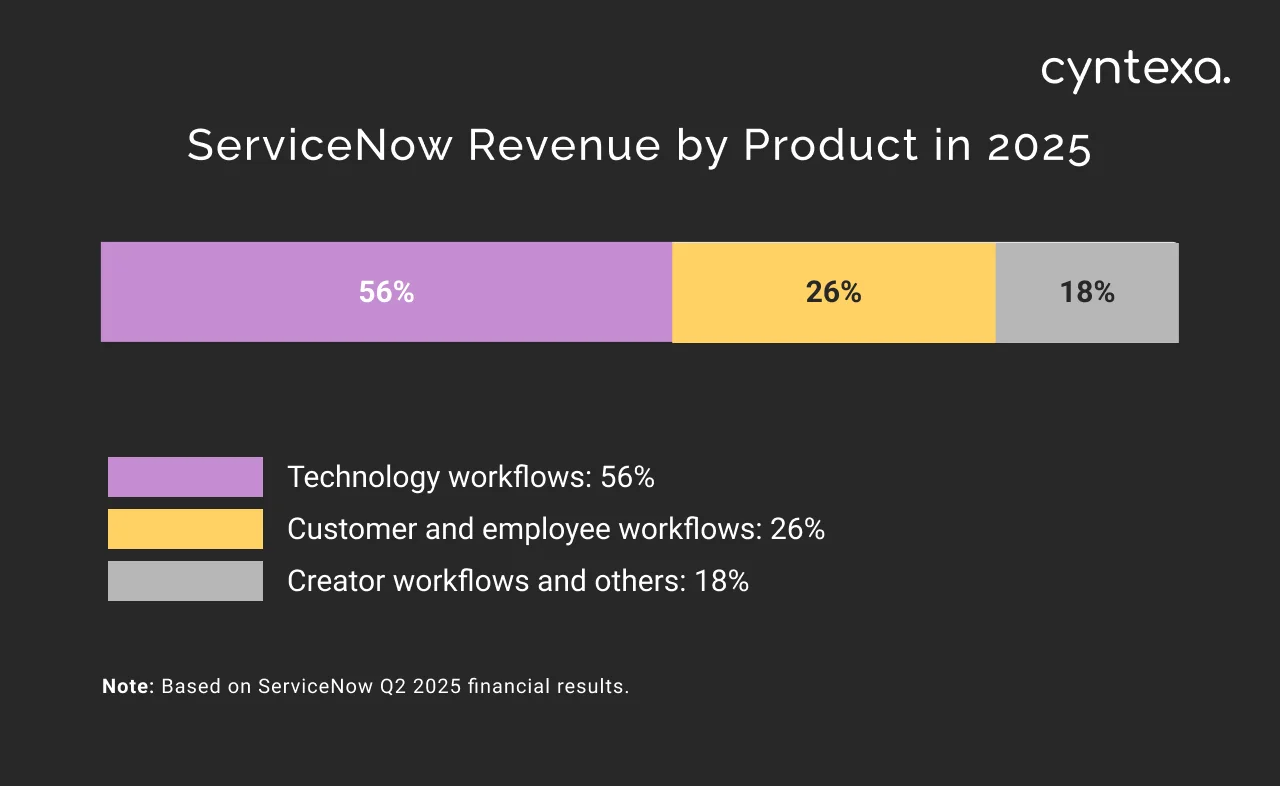
ServiceNow Revenue by Product in 2025
Technology workflows like IT Service Management, IT Operations Management, IT Asset Management, Security Operations, and more were the primary drivers of revenue. These workflows accounted for 47% of total revenue in 2025.
Customer and employee workflows like HR Service Delivery, Legal Service Delivery, Workplace Service Delivery, Customer Service Management, Field Service Management, and more are accounting for 31% of the total revenue.
Creator Workflows and others like App Engine, Automation Engine, Vault, Supplier Lifecycle Operations, are accounting for 22% of the total revenue.
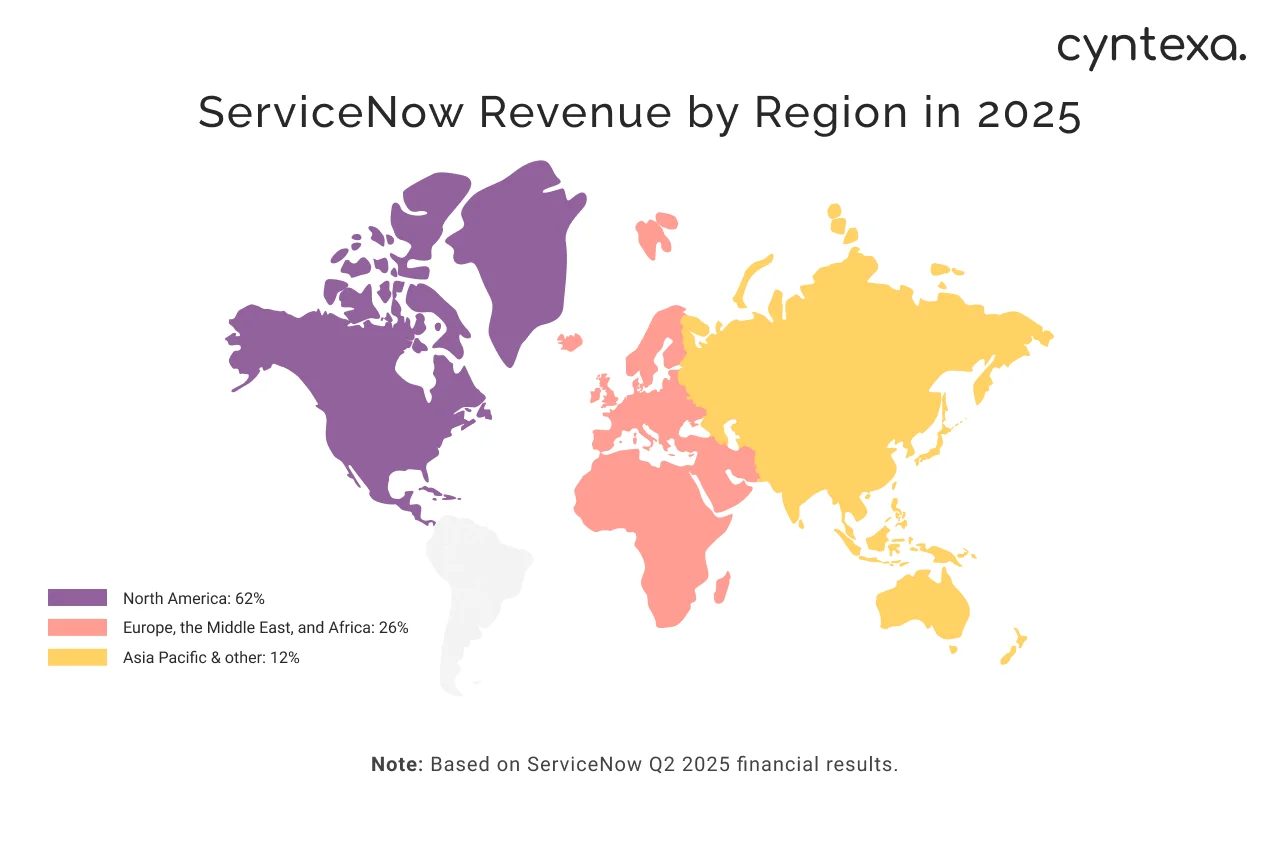
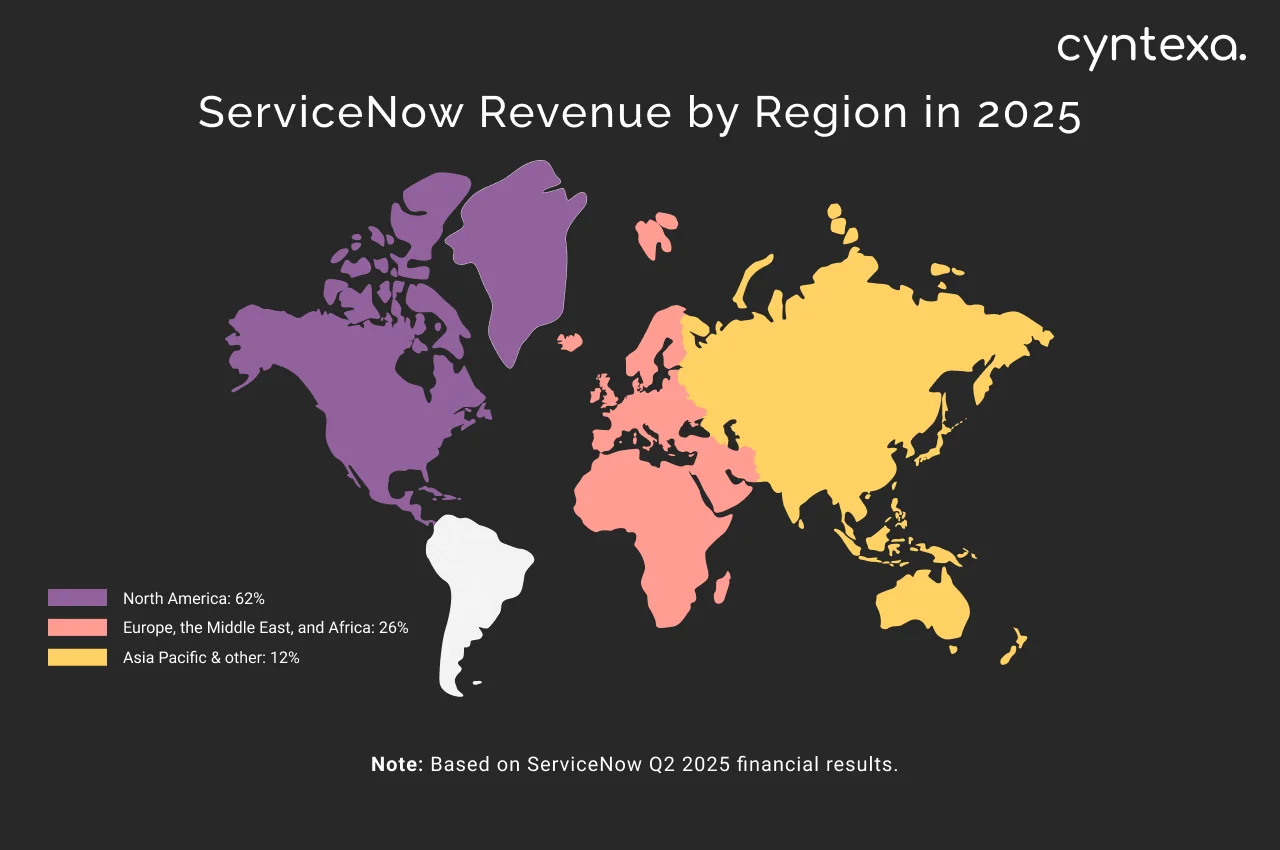
ServiceNow Revenue by Region in 2025
North America has been the dominant force in the ServiceNow market since 2022. In 2025, it accounted for a significant 63% of global revenue. The Europe, Middle East, and Africa (EMEA) region follows as the second-largest market, contributing 26% of revenue. The Pacific and other regions, consistently holding strong since 2024, represent the third-largest market with a 11% revenue contribution.
ServiceNow Revenue 2024
ServiceNow annual revenue in 2024 was $10.984B, with $10.646B from subscriptions and $329M from professional services and other sources, reflecting a 22.45% year-over-year (YoY) increase. Here is the ServiceNow revenue breakdown for each quarter of 2024:
| Q1 2024 financial results | |
|---|---|
| Subscription revenues | $2,523M |
| Professional services and other revenue | $80M |
| Total revenues | $2,603M |
| Q2 2024 financial results | |
|---|---|
| Subscription revenues | $2,542M |
| Professional services and other revenue | $85M |
| Total revenues | $2,627M |
| Q3 2024 financial results | |
|---|---|
| Subscription revenues | $2,715M |
| Professional services and other revenue | $82M |
| Total revenues | $2,797M |
| Q4 2024 financial results | |
|---|---|
| Subscription revenues | $2,866M |
| Professional services and other revenue | $91M |
| Total revenues | $2,957M |
ServiceNow revenue has been steadily growing each quarter with an average growth rate of 3.7%. ServiceNow is forecasted to reach $15B in revenue by 2026, as a prediction made in the Q2 financial results.
ServiceNow Revenue by Product in 2024
ServiceNow’s Annual Contract Value (ACV) is primarily driven by its Technology Workflows, which contribute 53% of the total. Customer and Employee Workflows collectively account for another 30%, while Creator Workflows make up the remaining 17%.


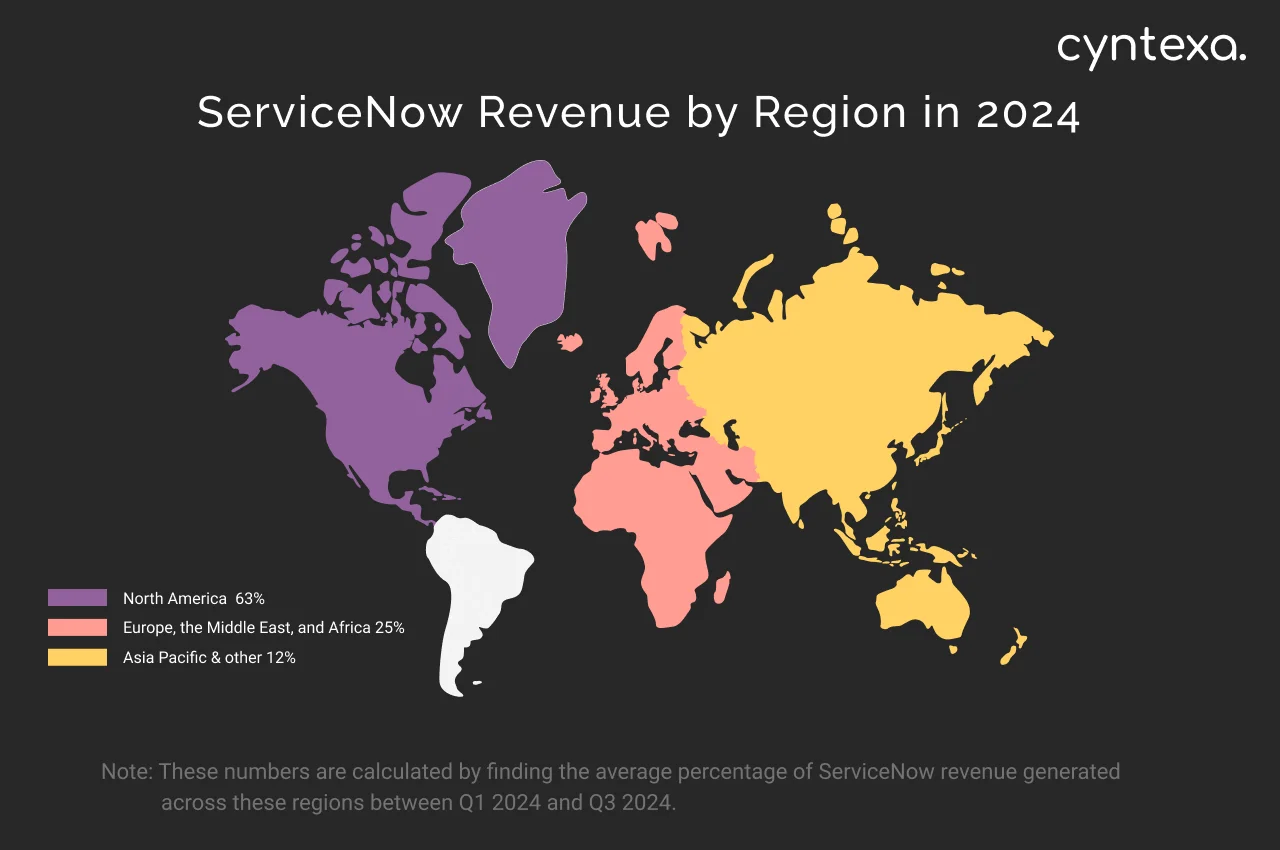
ServiceNow Revenue by Region in 2024
The North American region was ServiceNow’s biggest market in 2024, it contributed approximately 63% of the ServiceNow revenue in 2024. Europe, the Middle East, and Africa (EMEA) region, was the second biggest market with a 25% share in annual revenue. Asia Pacific and other regions had a 12% share in the revenue.

ServiceNow Revenue 2023
ServiceNow annual revenue in 2023 was $8.97B, out of which $8.68B was generated through the subscription. In Q1 2023, it was the first time when ServiceNow made over $2B in revenue, and since then this trend has maintained.
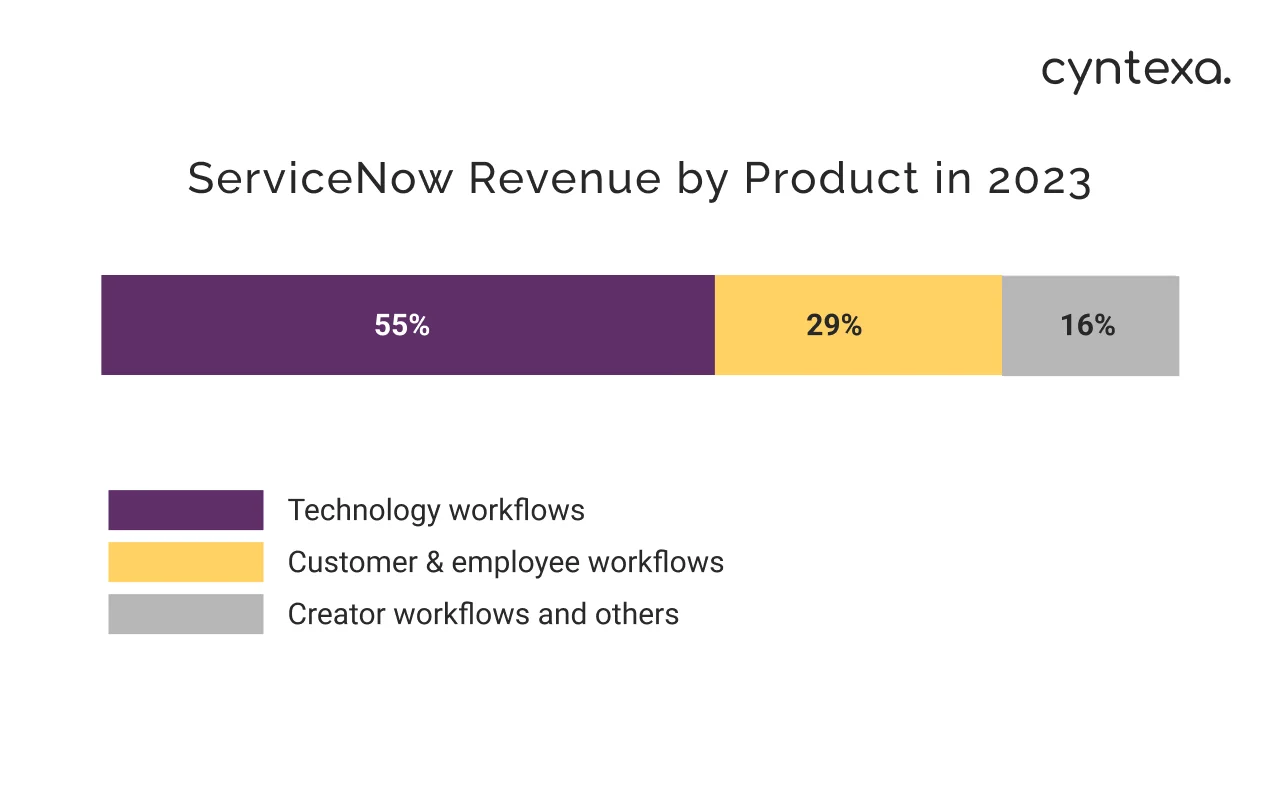
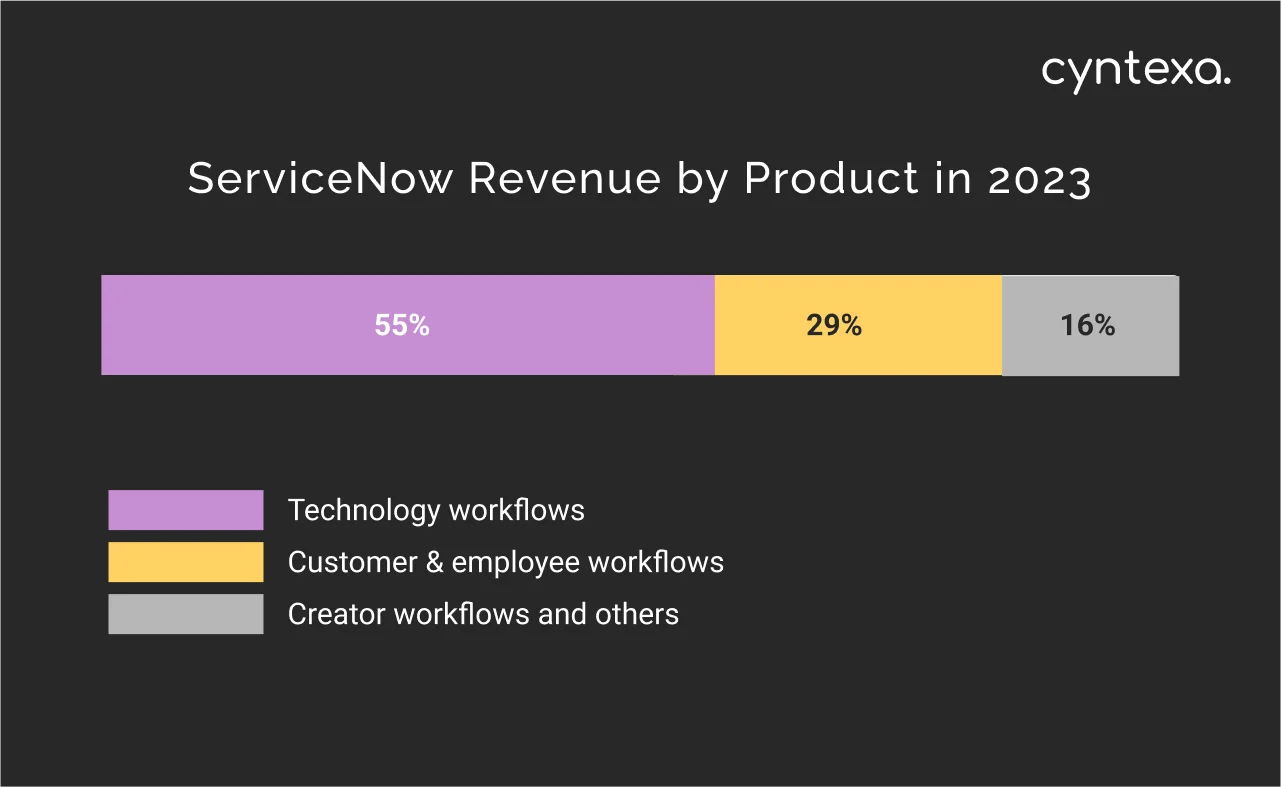
ServiceNow Revenue by Product in 2023
Technology workflows accounted for around 55% of the annual contract value for ServiceNow in 2023. Customer and employee workflows accounted for 29%, and creator workflows accounted for 16% of the ACV for ServiceNow.
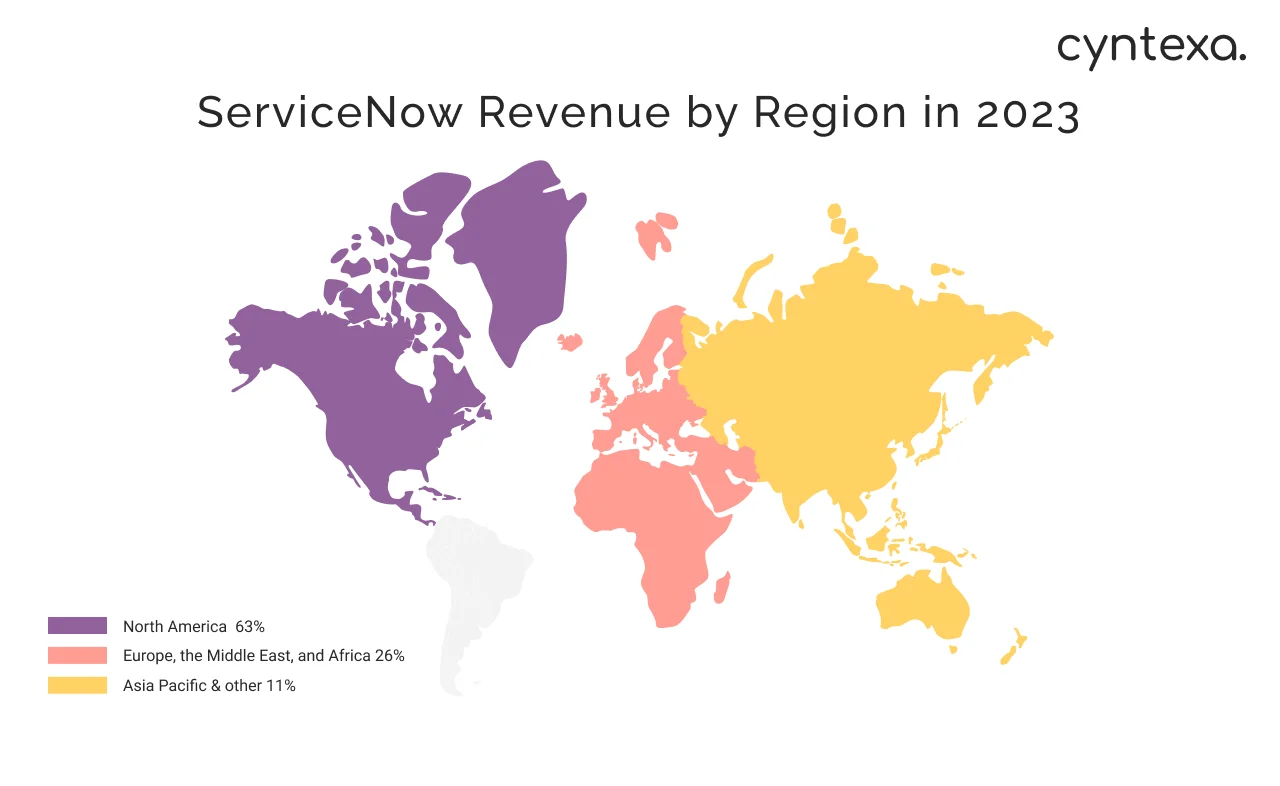
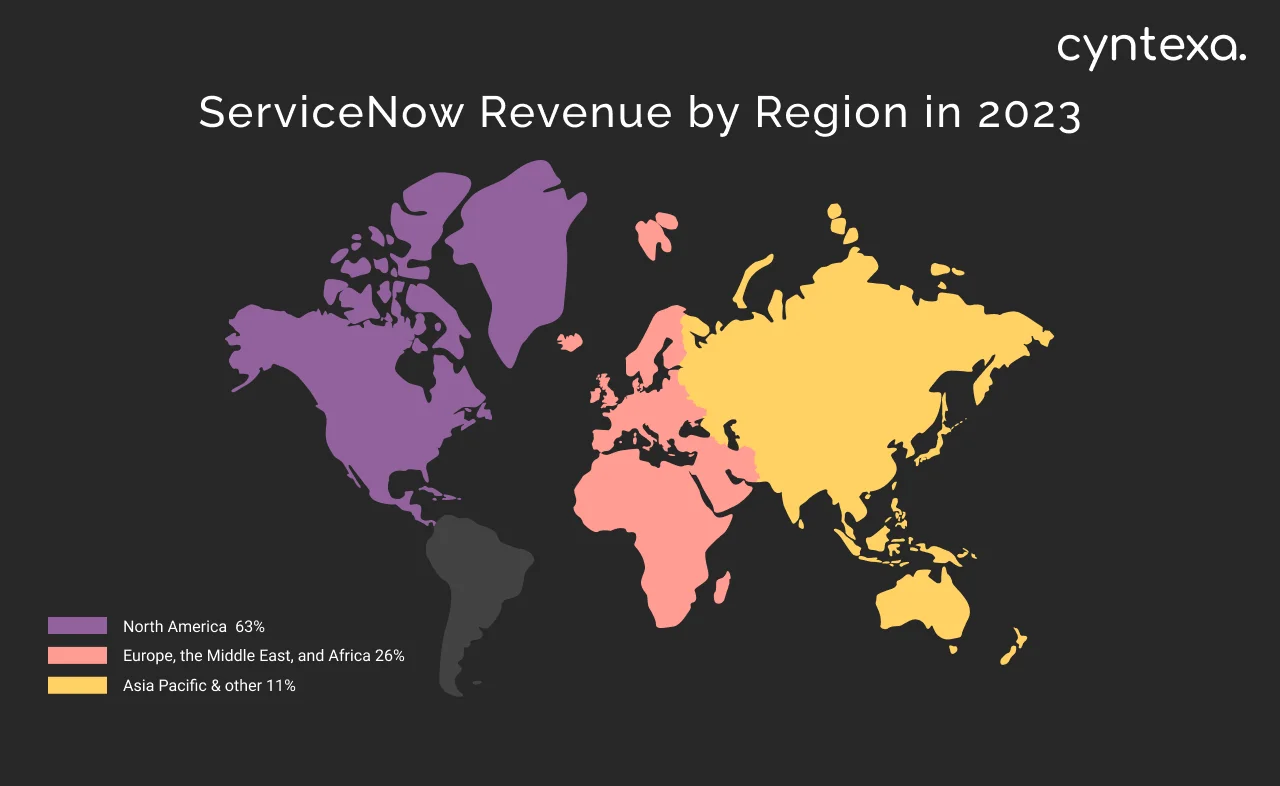
ServiceNow Revenue by Region in 2023
North America accounted for 63% of the ServiceNow revenue in 2023. Europe, the Middle East, and Africa contributed 26% of the revenue. Asia Pacific and other regions accounted for 11% of the revenue.
ServiceNow Revenue 2022
ServiceNow annual revenue in 2022 was $7.245B, a significant portion of which $6.891B was generated through the subscription.
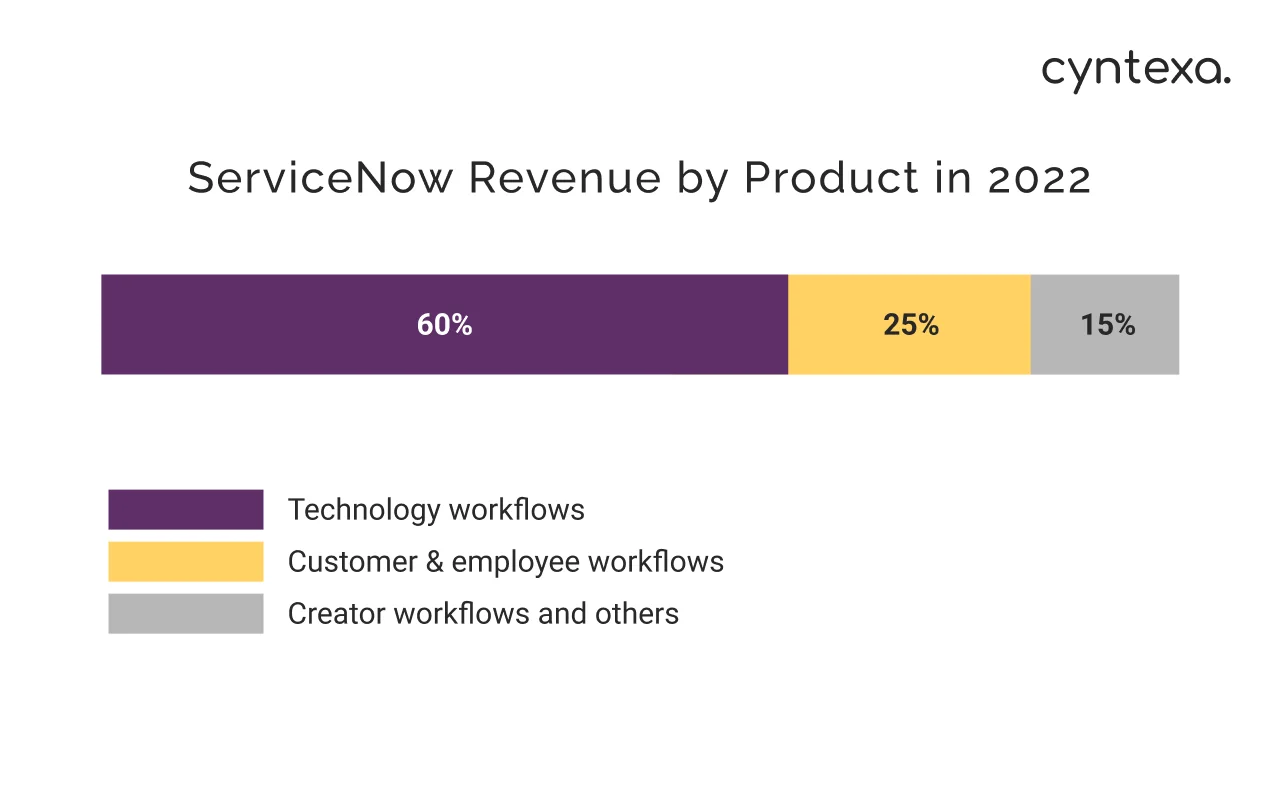
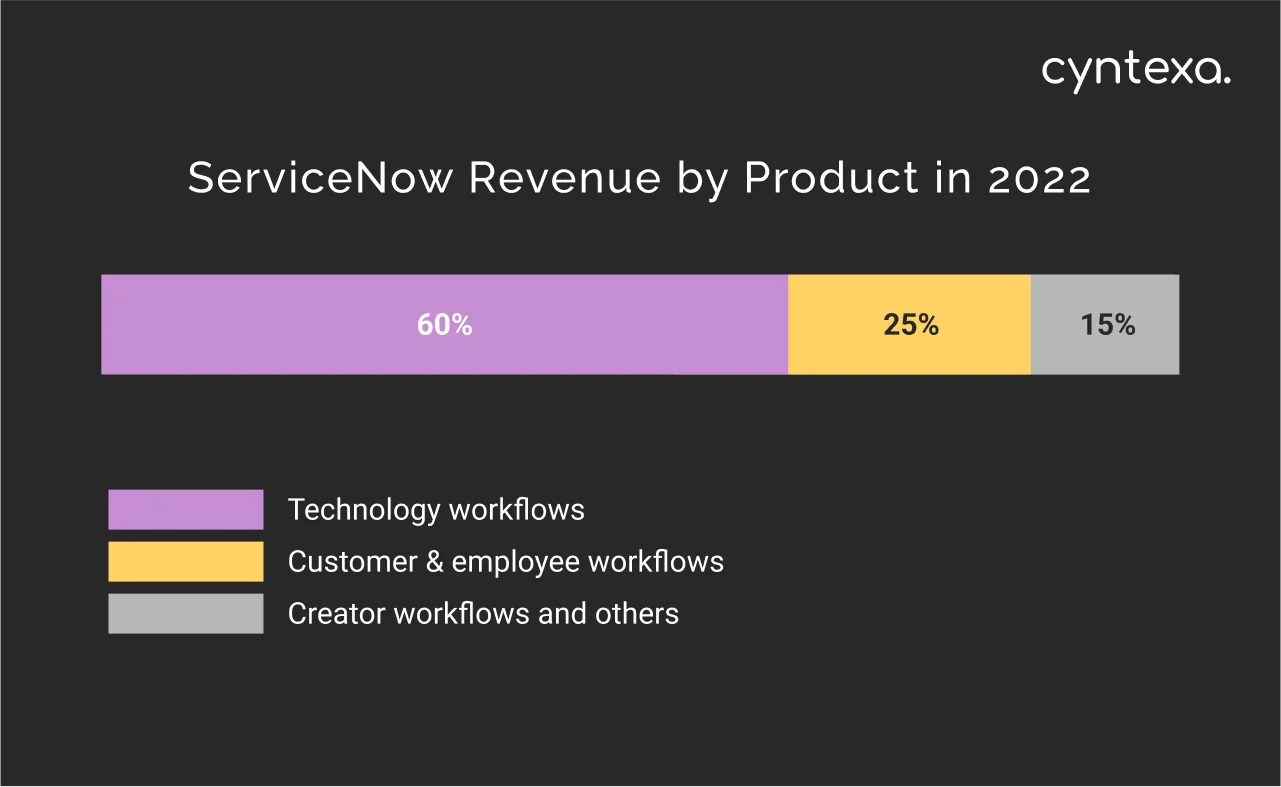
ServiceNow Revenue by Product in 2022
Technology workflows like IT Operations Management, ITSM, and ITAM made up 60% of ServiceNow ACV. Customer & employee workflows, and creator workflow, and others respectively, accounted for 25%, and 15% of the ServiceNow revenue.
ServiceNow Revenue by Region in 2022
Americas is by far the biggest contributor to ServiceNow revenue. In 2022, 65% of the annual revenue was generated from the Americas. With 25% of the revenue, Europe, the Middle East, and Africa were the second largest contributors. Asia-Pacific and other regions made 10% of the ServiceNow annual revenue in 2022.


ServiceNow Revenue From 2015 to 2025
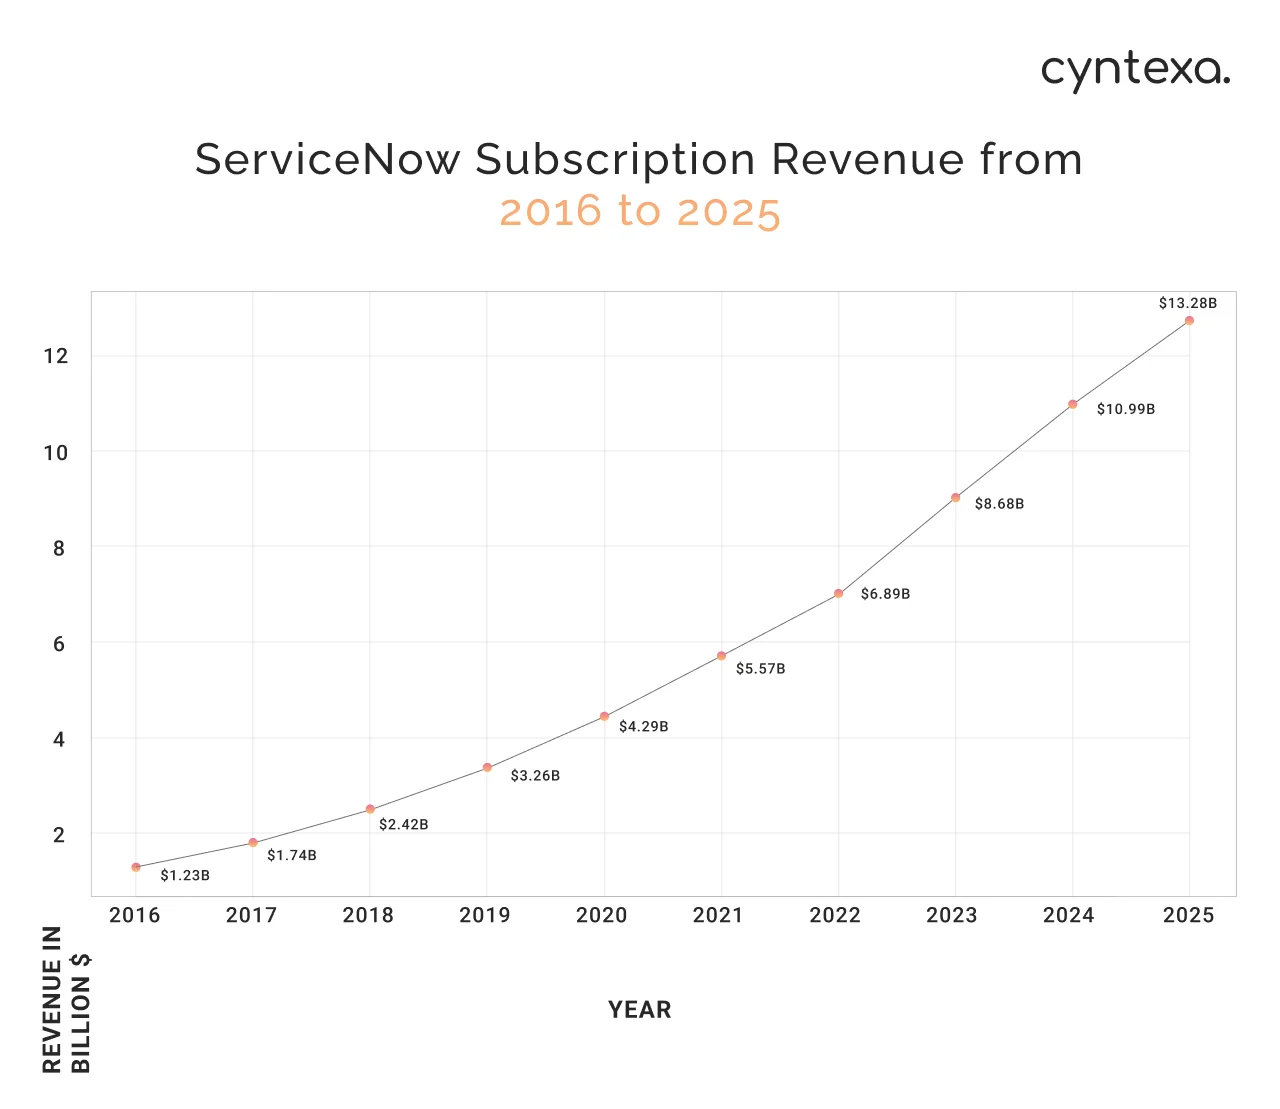
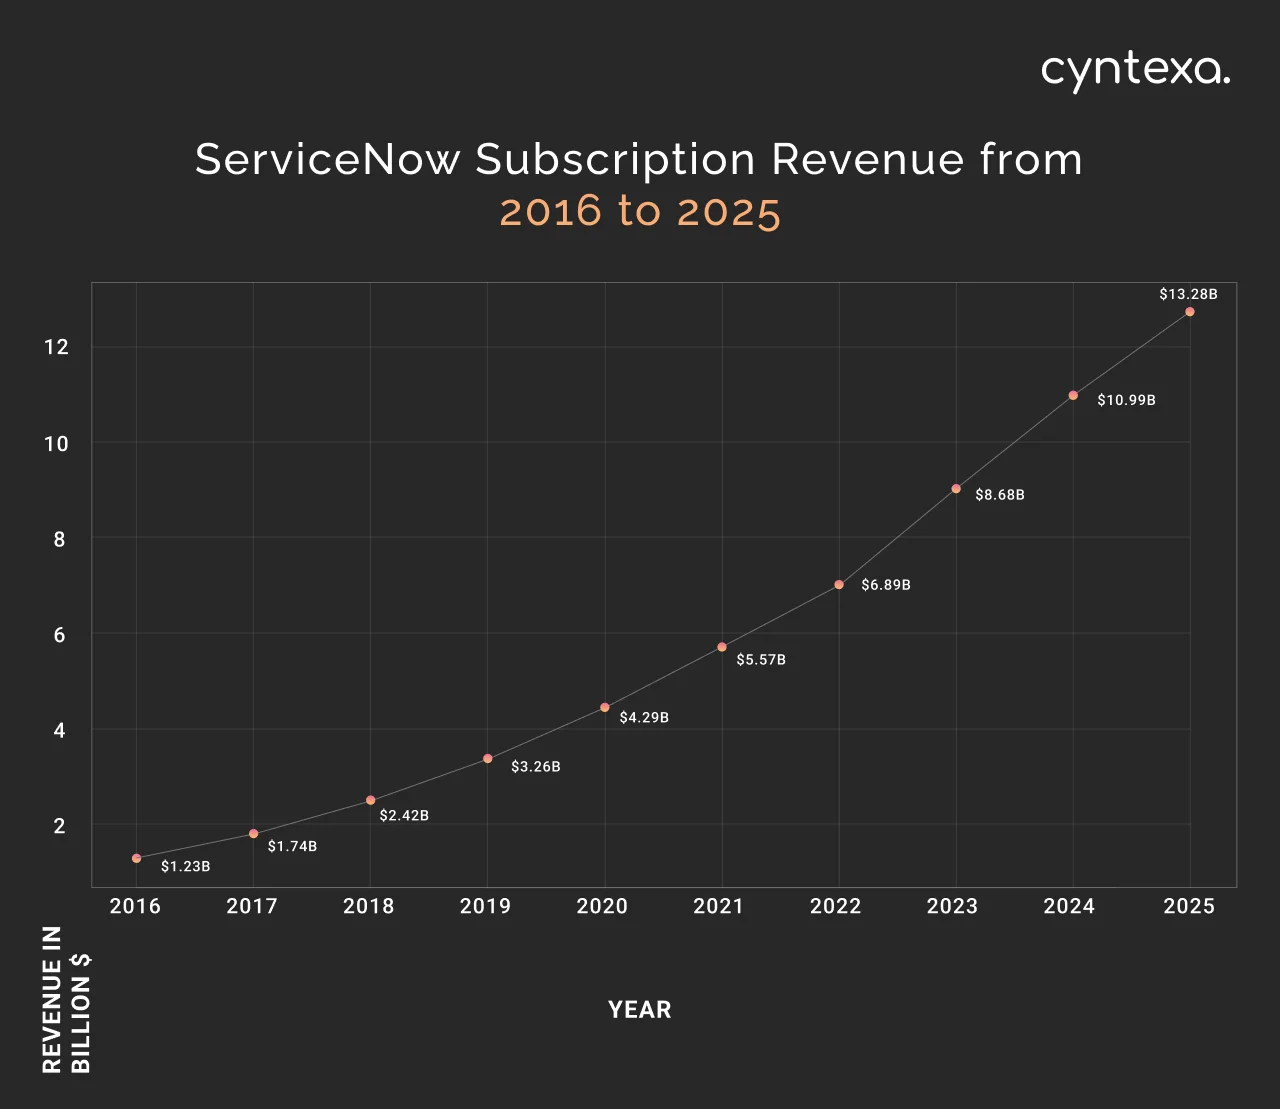
Subscription revenue is the major contributor to the ServiceNow growth from 2015 to 2025. In 2015, ServiceNow’s total revenue was $1.005B, making it the second enterprise SaaS company to surpass $1 billion in revenue, followed by Salesforce. Salesforce achieved the milestone of $1 billion in revenue in 2009.
| ServiceNow Subscription Revenue from 2016 to 2024 | |
|---|---|
| 2016 | $1.23B |
| 2017 | $1.74B |
| 2018 | $2.42B |
| 2019 | $3.26B |
| 2020 | $4.29B |
| 2021 | $5.57B |
| 2022 | $6.89B |
| 2023 | $8.68B |
| 2024 | $10.99B |
| 2025 | $13.28B |
Here is an overview of ServiceNow subscription revenue from 2016 to 2025 showing the unwavering growth:
ServiceNow Revenue Growth From 2017 to 2025
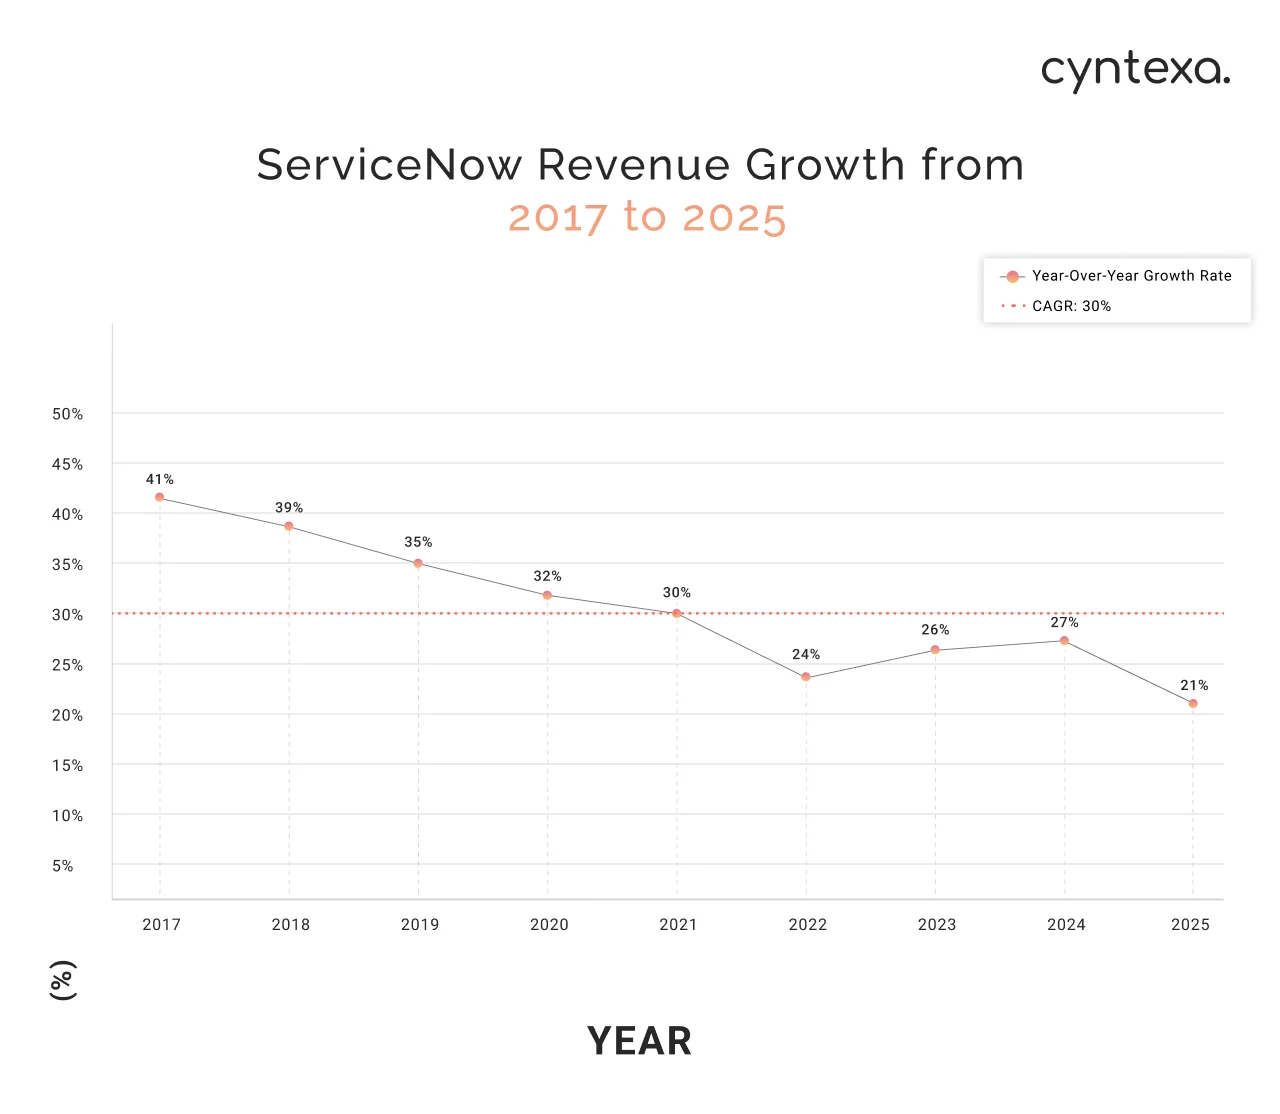
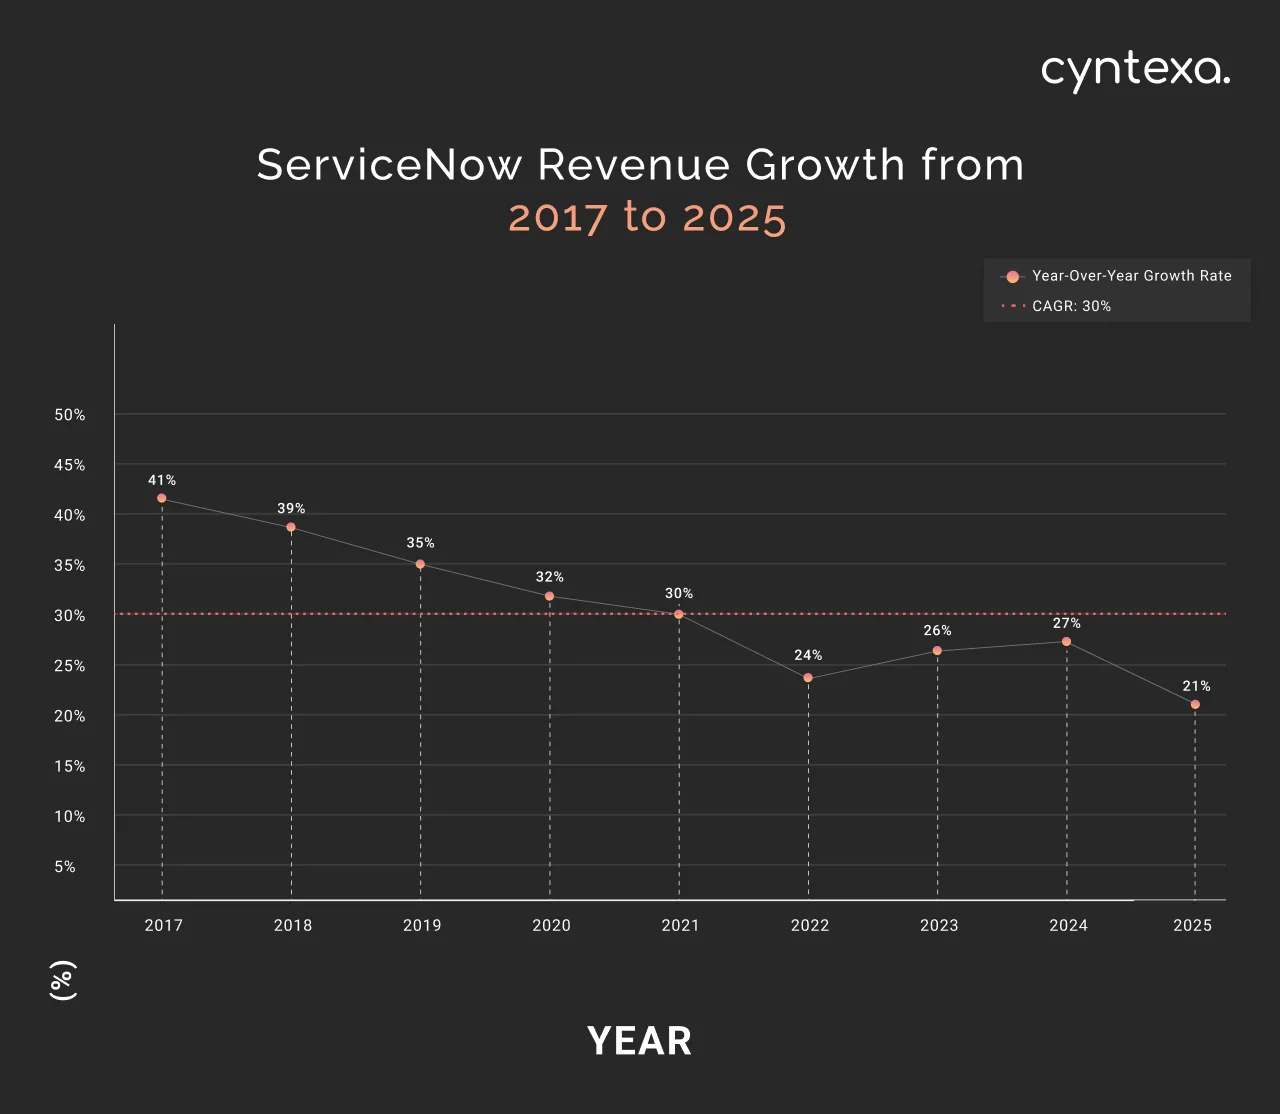
ServiceNow yearly revenue grew at a compound annual growth rate (CAGR) of approximately 30% from 2016 to 2025. Here is the summary of year-over-year growth in the revenue:
| ServiceNow Revenue Growth from 2017 to 2024 | |
|---|---|
| 2017 | 41% |
| 2018 | 39% |
| 2019 | 35% |
| 2020 | 32% |
| 2021 | 30% |
| 2022 | 24% |
| 2023 | 26% |
| 2024 | 27% |
| 2025 | 21% |
ServiceNow Market Share 2025
ServiceNow is a pioneer name when it comes to technology workflows, outshining its competitors like BMC, Atlassian, Microsoft, IBM, and more. Looking ahead, ServiceNow, with continuous innovations in the field of Agentic AI. By the end of 2025, ServiceNow will have 1,000+ AI agents working autonomously and proactively across technology, customer & employee, creator workflows, and others.
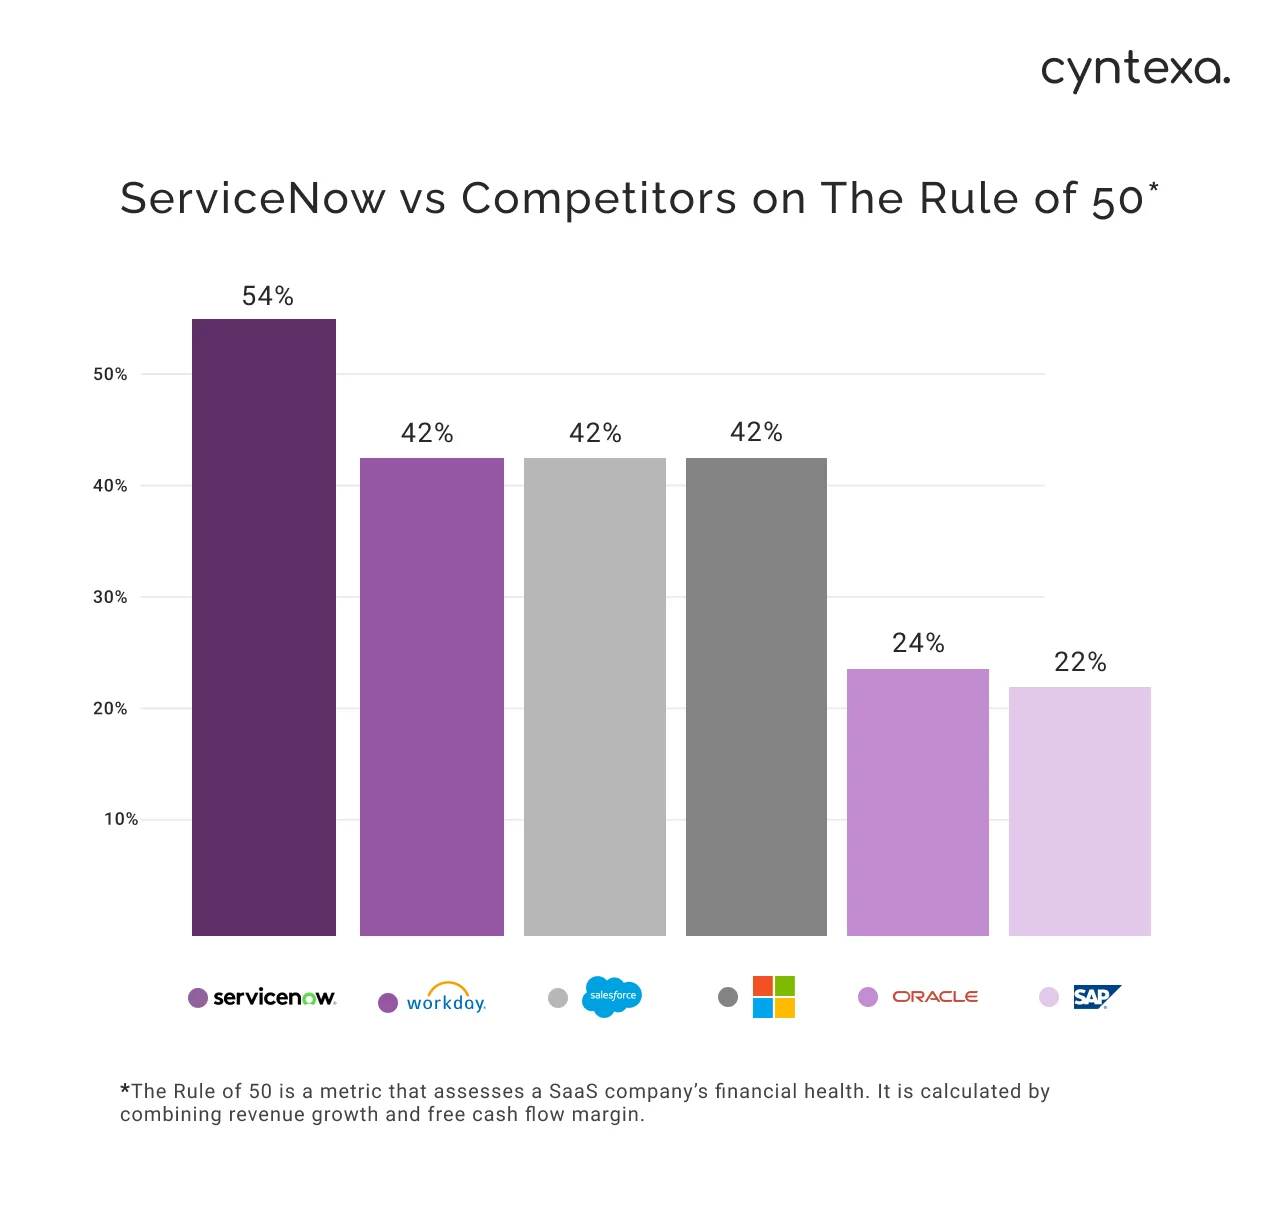
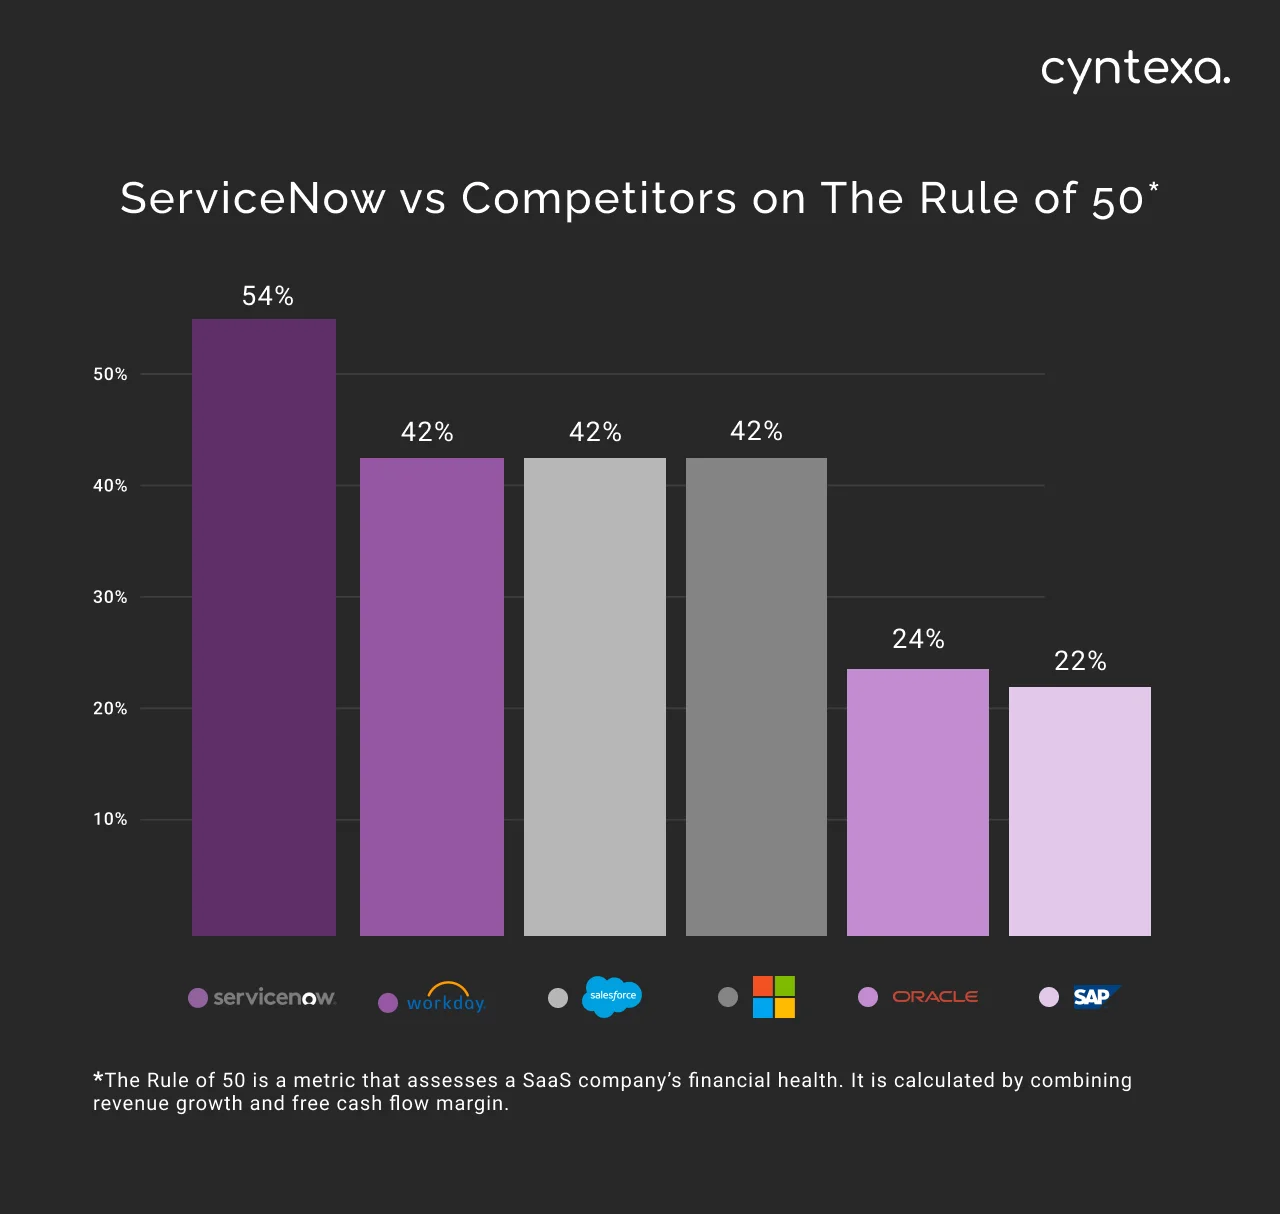
A key indicator of ServiceNow’s dominating marketing share is its standing against major competitors on the Rule of 50+ metric. This metric combines the revenue growth and free cash flow margin, which is a standard for measuring a Software-as-a-Service (SaaS) company’s financial health and efficiency. ServiceNow achieved a score of 54%, making it the only company in its peer group, which includes Workday (42%), Salesforce (42%), Microsoft (42%), Oracle (24%), and SAP (22%) to exceed the Rule of 50 benchmark. This explicitly demonstrates ServiceNow’s market share compared to its peers.
ServiceNow has been reorganized as the global leader by several research firms across different categories. This suggests the dominance of ServiceNow over its competitors.
IDC MarketScape: Worldwide AI-Enabled Asset-Intensive Enterprise Asset Management Applications 2025–2026 Vendor Assessment
IDC Marketplace recognised ServiceNow as a leader among the AI-enabled EAM application vendors worldwide, such as Hitachi Energy LLC, Hexagon AB, IBM, Oracle Corporation, SAP SE, etc.
Fortune World’s Most Admired Companies 2026™
ServiceNow ranks among Fortune’s Most Admired Companies™, placing 2nd in the computer software category.
Glassdoor’s 2026 Best Places to Work
ServiceNow ranks #2 on Glassdoor’s Best Companies to Work in Tech & IT and #7 in Best Places to Work.
America’s Growth Leaders of 2026
ServiceNow ranks among America’s Growth Leaders of 2026, including companies like Nvidia, Tesla, and Optex Systems.
Magic Quadrant for Business Orchestration and Automation Technologies
Magic Quadrant assesses 20 BOAT vendors based on their business orchestration and automation capabilities. The ServiceNow AI platform has been recognized as the leader in the Magic Quadrant.
Magic Quadrant for AI Applications in IT Service Management
Magic Quadrant evaluated 10 vendors based on their AI capabilities in making IT Service Management more efficient. ServiceNow has been recognized as the leader for its AI features in its ITSM platform.
Magic Quadrant for Enterprise Low-Code Application Platforms
For the sixth year running, ServiceNow’s App Engine has been recognized as a leader in low-code app development platforms in 2025.
The Forrester Wave™: Low-Code Platforms For Professional Developers, Q2 2025
Forrester compared 13 providers of low-code platform providers for professional developers. These providers are compared based on 12 criteria, which include innovation, GenAI, agentic tools, digital process automation, tools for coding, integration, development tools, and adapters, etc.
ServiceNow has been recognized as the leading low-code platform for both citizen and professional developers.
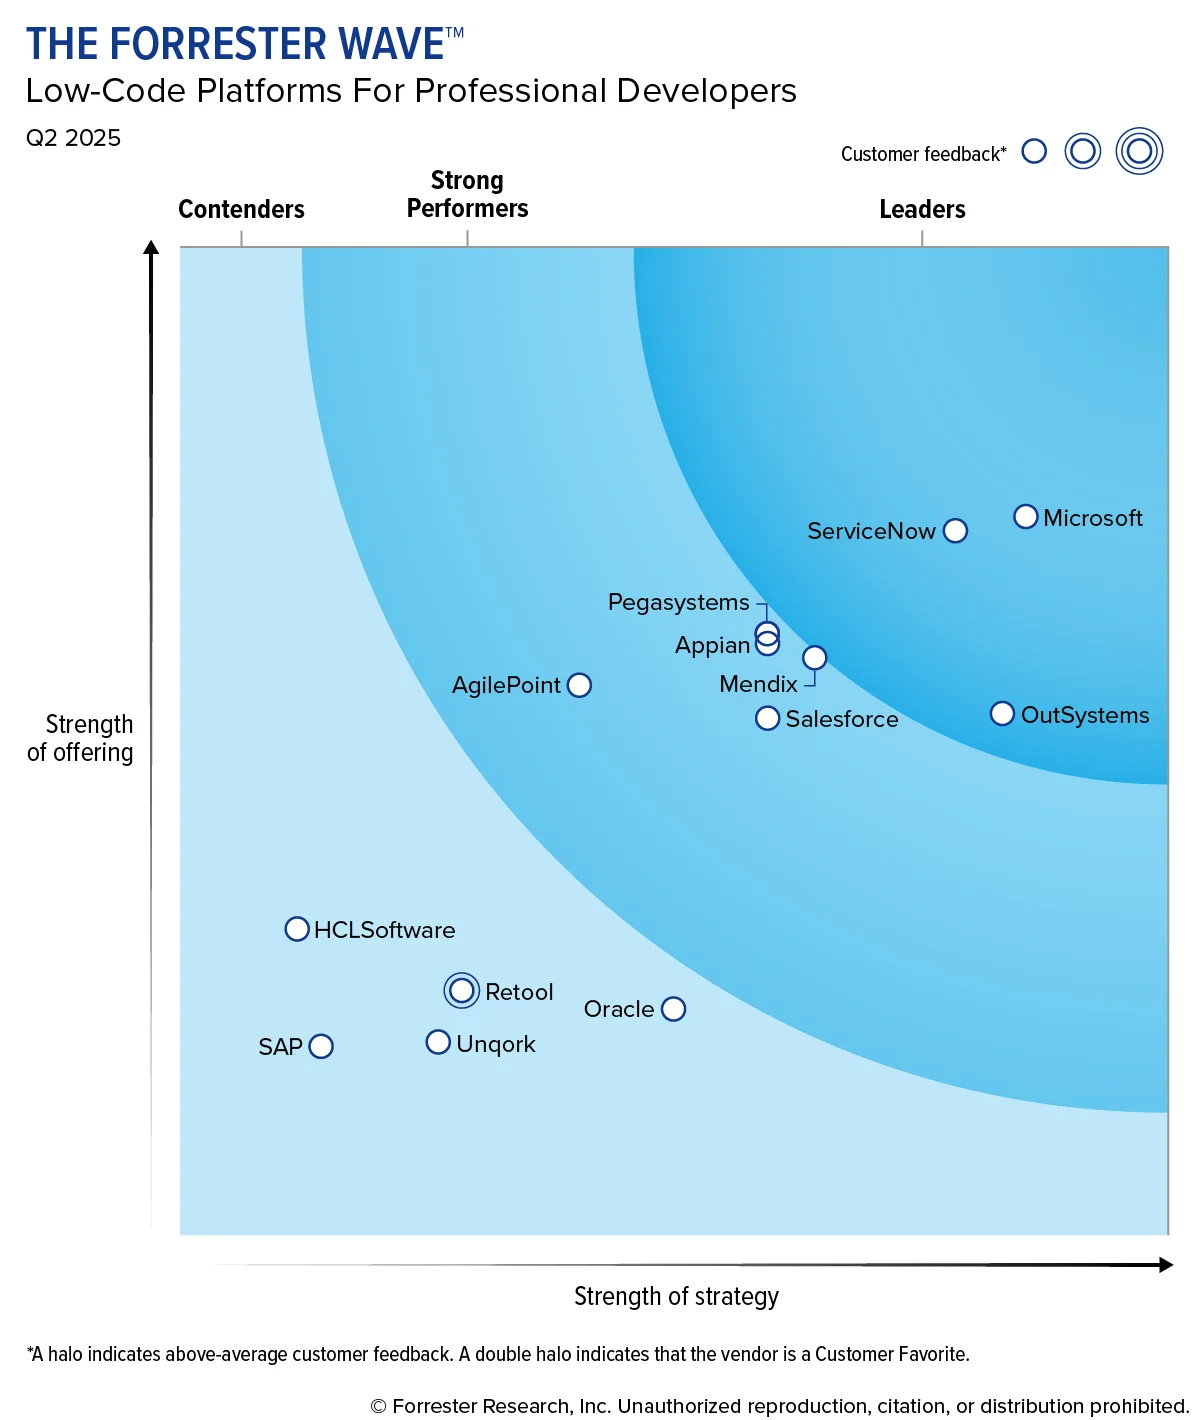
Image source: The Forrester Wave™: Low-Code Platforms For Professional Developers, Q2 2025
IDC MarketScape: Worldwide Business Automation Platforms 2025 Vendor Assessment
ServiceNow has been named as a leader in the 2025 IDC MarketScape for worldwide business automation platforms. This recognition is the result of IDC analysis across the 8 technology segments:
- Business Process Automation (BPA)
- Robotic Process Automation (RPA)
- End-to-end orchestration
- Automation planning
- Agentic automation
- Decision automation
- Platform and life-cycle management
- Performance measurement
ServiceNow offers end-to-end capabilities spanning every segment.
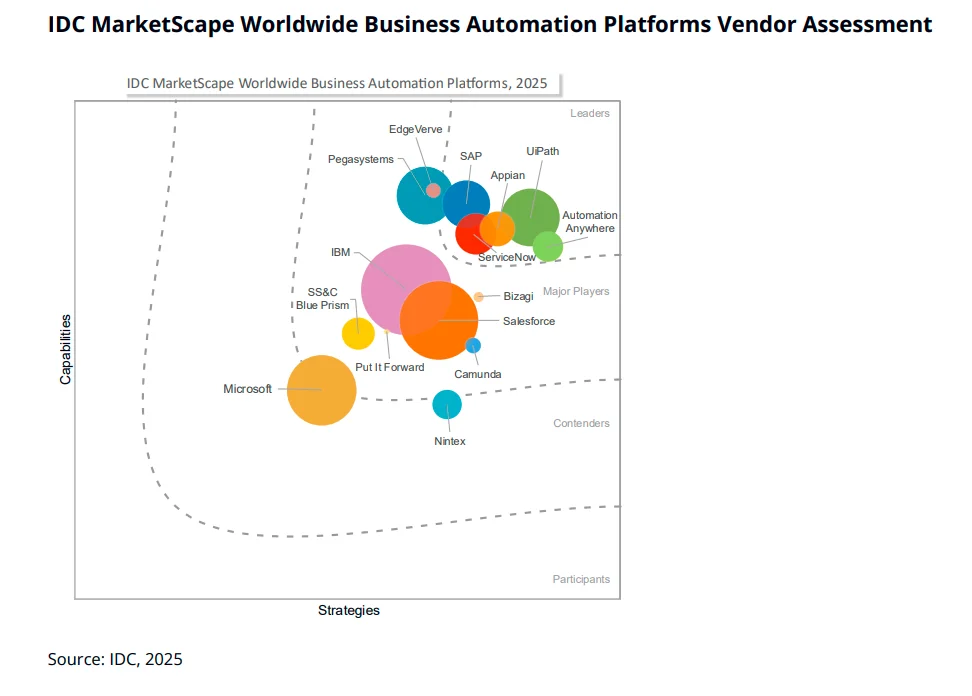
Image source: IDC MarketScape: Worldwide Business Automation Platforms 2025
ServiceNow Earns Fortune 500® Recognition for Third Consecutive Year
ServiceNow secured its position on the Fortune 500® list for the third year in a row. It is an achievement for ServiceNow and demonstrates its dominance over its peers.
ServiceNow Ranks Among America’s Most Trusted Companies by Forbes
ServiceNow secured the second position among America’s most trusted companies based on factors such as employee & customer trust, investor trust, and media sentiment.
2024 Gartner® Magic Quadrant
Gartner named ServiceNow as a leader for the following:
- AI Applications in IT Service Management (ITSM).
- Enterprise Low-Code Application Platforms for the fifth consecutive year.
The Forrester Wave™
The Forrester Wave recognized ServiceNow as a leader in 2024 in its different reports, such as:
- The Forrester Wave™: Task‑Centric Automation Software (TCAS)
- Forrester Wave™: P&C Claims Management Systems, Q2 2024
- Forrester Wave™: Strategic Portfolio Management Tools, Q2 2024
- Forrester Wave™: Customer Service Solutions, Q1 2024
- Forrester Wave™: Third‑Party Risk Management Platforms, Q1 2024
IDC MarketScape Vendor Assessment
ServiceNow has been recognized as the leader in the following two IDC MarketScape worldwide reports:
- IDC MarketScape: Worldwide SaaS and Cloud‑enabled Spend Orchestration 2024 Vendor Assessment
- IDC MarketScape for Multicloud and Hybrid Cloud Management with Automation
- Worldwide Value Stream Management (VSM) and Agile Project and Portfolio Management 2023‑2024
- Worldwide Strategic Portfolio Management (SPM) and IT Project and Portfolio Management 2023‑2024
ServiceNow Customers
ServiceNow is delivering great experiences and unlocking productivity for its customers. ServiceNow customers sit at the top of the industries, including education, healthcare, financial services, government, manufacturing, retail, and more.
How Many Customers Does ServiceNow Have in 2025?
As of December 31, 2025 (Q4 2025), ServiceNow has 8,800 customers worldwide, including 85% of Fortune 500 companies. Among these, 603 customers each generate more than $5 million in annual contract value.
How Many Customers Does ServiceNow Have in 2024?
As of 2024, ServiceNow supports over 8,400 organizations worldwide, including 85% of Fortune 500 companies. Beyond this in quarter-wise financial results, ServiceNow disclosed the number of customers who have more than $1M in annual contract value (ACV).
In Q1 2024, ServiceNow had 1,922 with an average annual contract value of $4.6M. In Q2 2024, ServiceNow added 49 new customers resulting in a total of 1,971 customers with an average ACV of $4.7M. Continuing this growth, ServiceNow landed 47 new customers in Q3 2024, resulting in a total of 2,018 customers with an average ACV of $4.8M. At the end of Q4 2024, ServiceNow had 2,109 customers with an average ACV of $5M.


The Number of Companies That Use ServiceNow in 2023
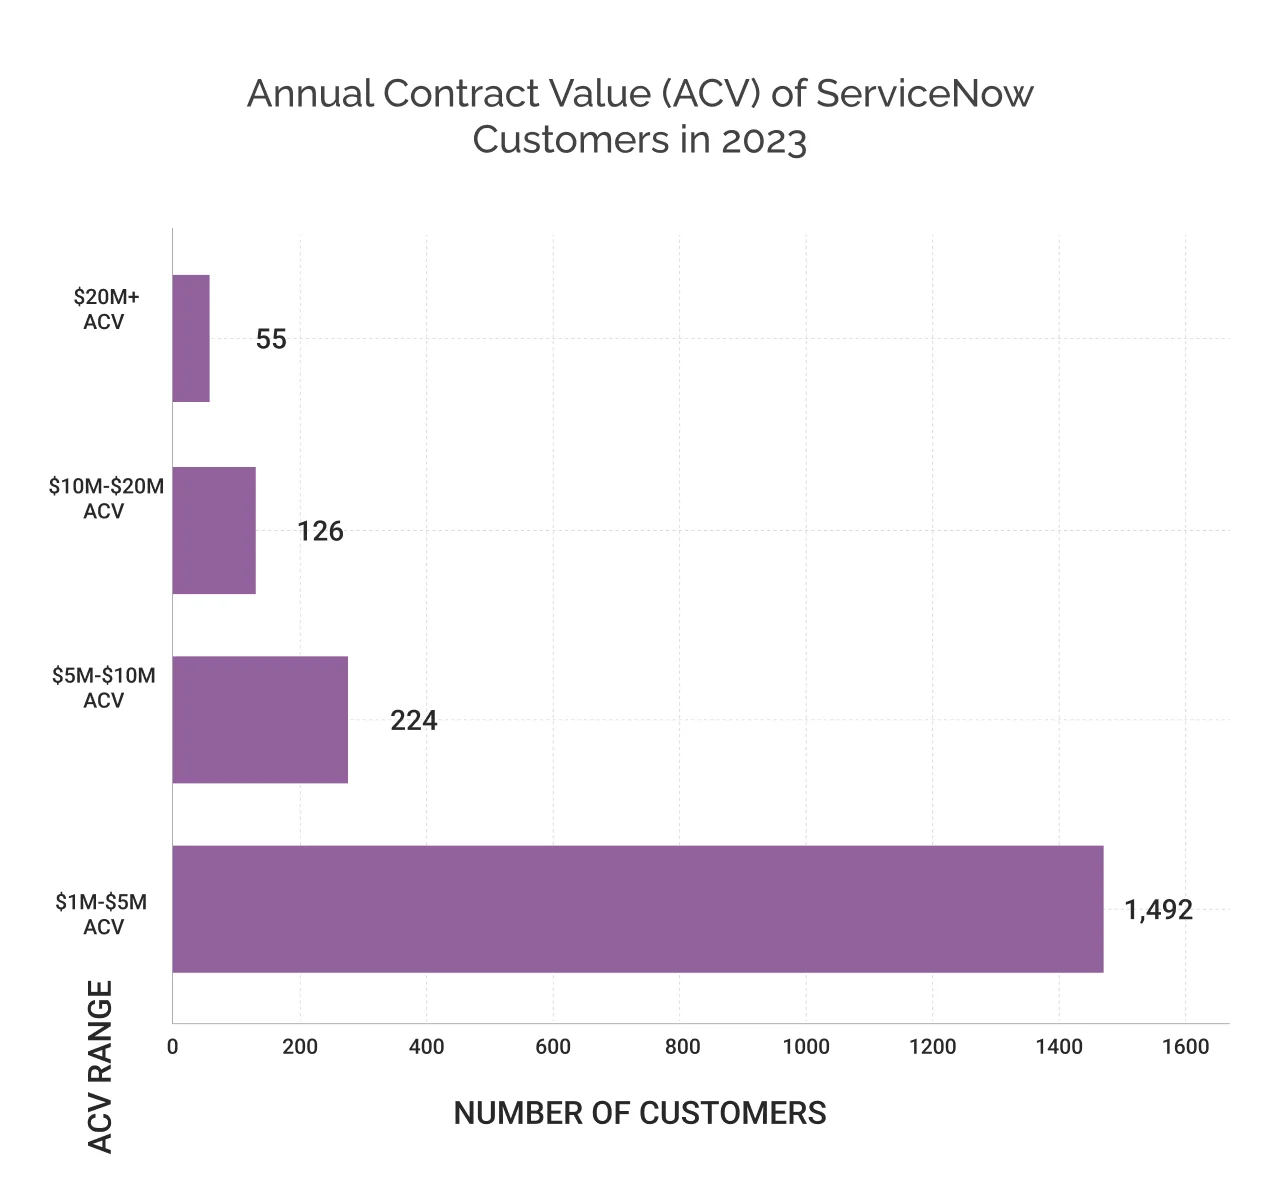
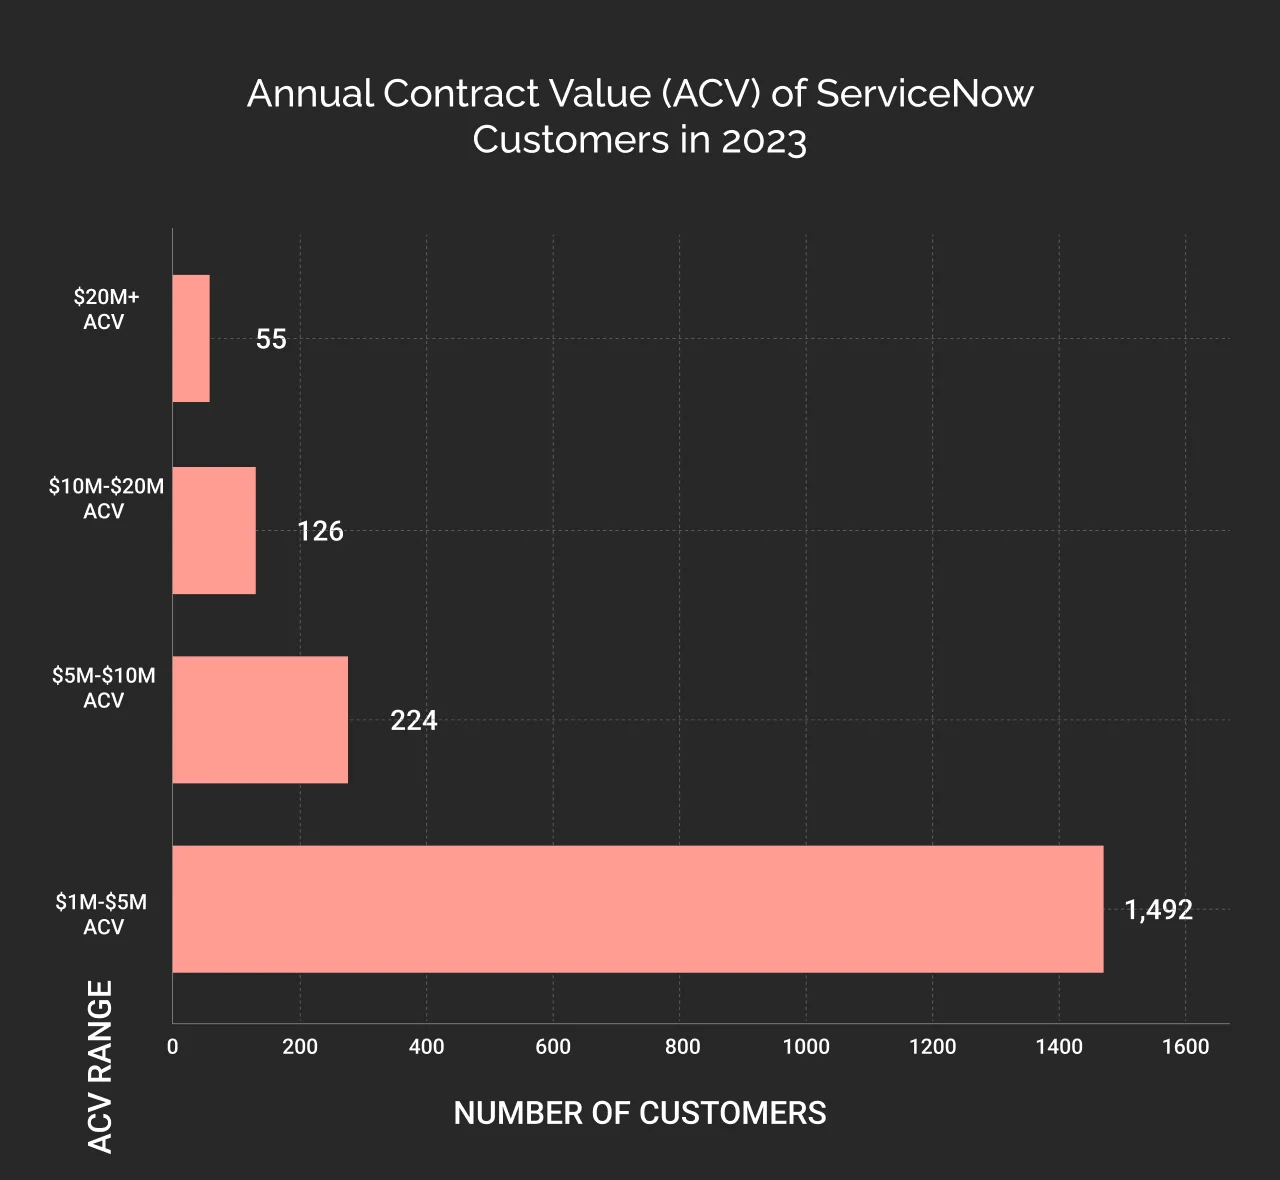
ServiceNow had 8,100+ customers at the end of 2023, with the company adding nearly 400 new customers. ServiceNow doubled (2.2x) the number of customers with 20M+ ACV in comparison to 2021. 98.5% of the customers were renewed suggesting the unwavering confidence of customers in ServiceNow. Also, approximately 70% of customers grew ACV.
Here is a breakdown of the companies that use ServiceNow in 2023 based on their annual contract value:
- 1,492 customers with $1M-$5M ACV
- 224 customers with $5M-$10M ACV
- 126 customers with $10M-20M ACV
- 55 customers with $20M+ ACV
ServiceNow Customers in 2022
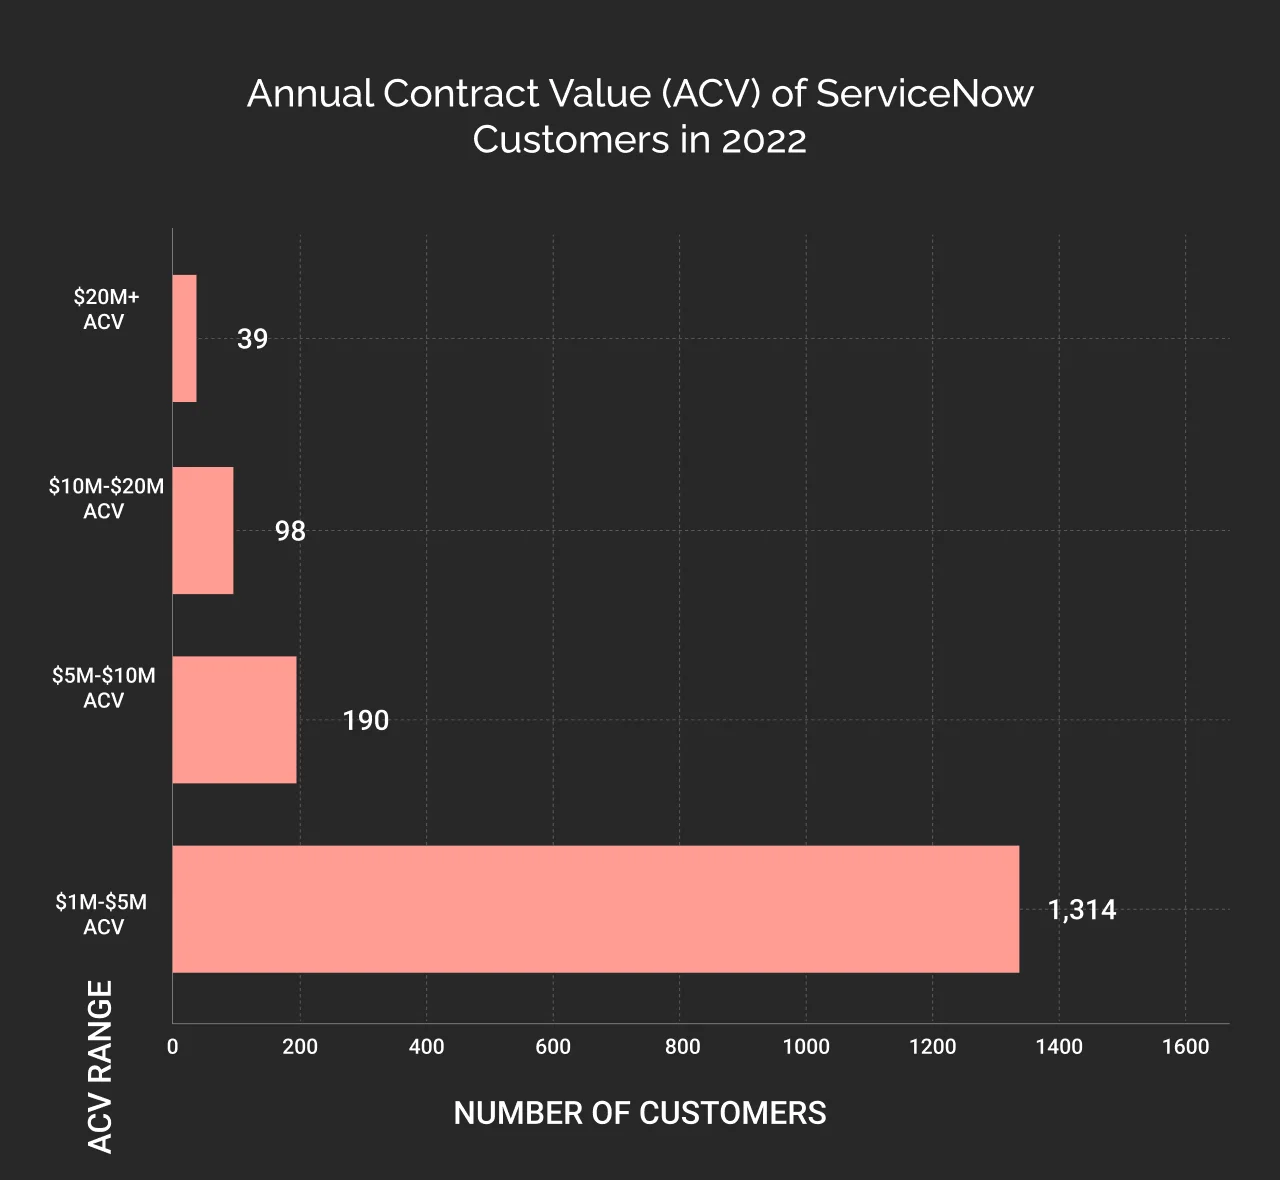
ServiceNow had 7,770 customers at the end of year 2022. The company landed 70+ new customers this year, notably 8 of these customers are among the global 100.
ServiceNow retained the contracts with 98% of its customers and generated a 25% higher revenue per customer, resulting in 125% of the net expansion rate. Also, the number of customers with AVC of $5M has increased by four times between 2018-2022.
Here is a breakdown of ServiceNow customer base in 2022 based on their annual contract value:
- 1,314 customers with $1M-$5M ACV
- 190 customers with $5M-$10M ACV
- 98 customers with $10M-20M ACV
- 39 customers with $20M+ ACV

ServiceNow Customers in 2021
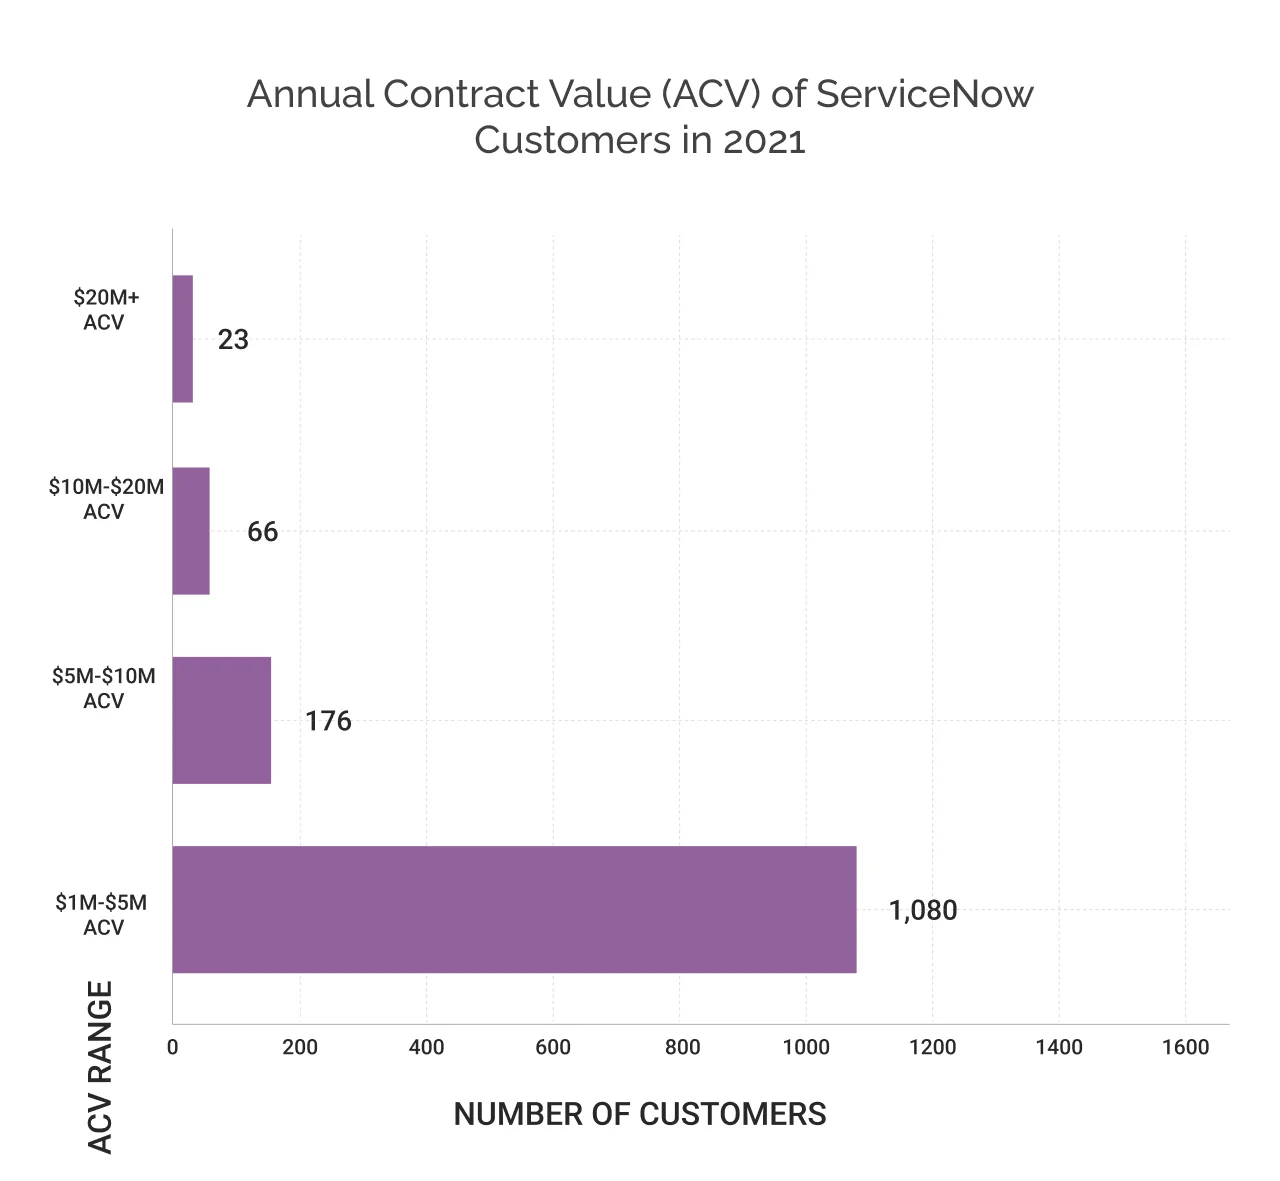
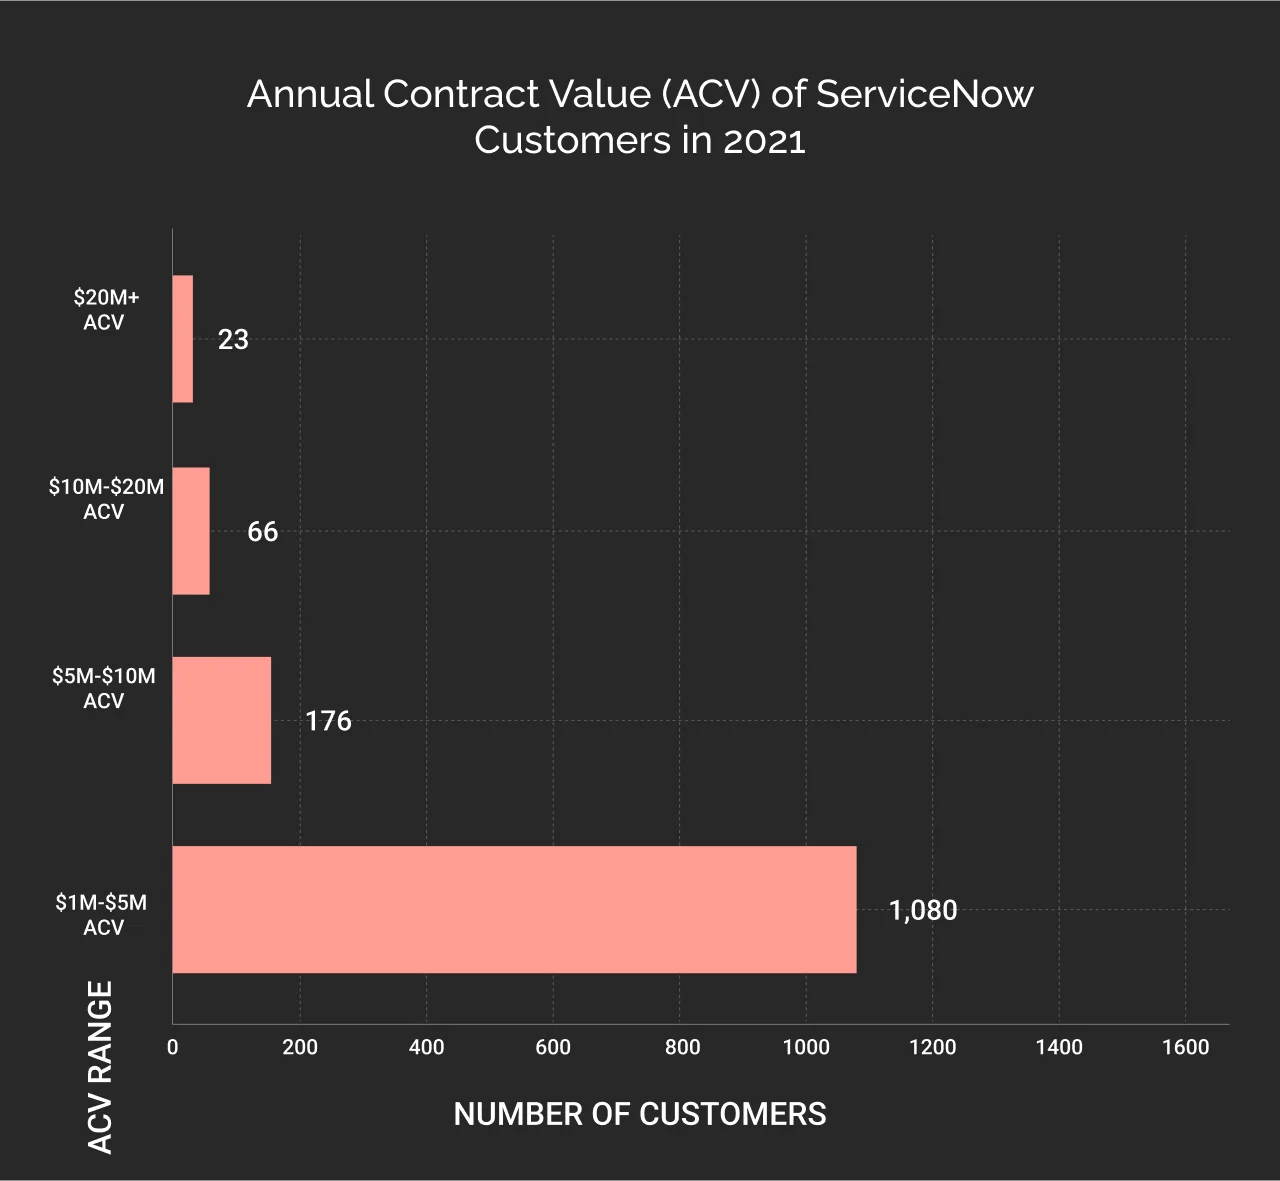
Over 7,700 global enterprises were using ServiceNow in 2021 including 85% of the Fortune 500 companies. ServiceNow had 1,345+ customers with 1M+ annual contract value in 2021.
Here is a breakdown of the customers according to the annual contract value:
- 1,080 customers with $1M-$5M ACV
- 176 customers with $5M-$10M ACV
- 66 customers with $10M-20M ACV
- 23 customers with $20M+ ACV
ServiceNow’s Biggest Customers Growth from 2021 to 2024
ServiceNow is experiencing significant growth in the number of its biggest customers. The number of customers spending over 1M+ with ServiceNow annually has doubled from 1,080 in the year 2021 to 2,109 customers at the end of fiscal year 2024.
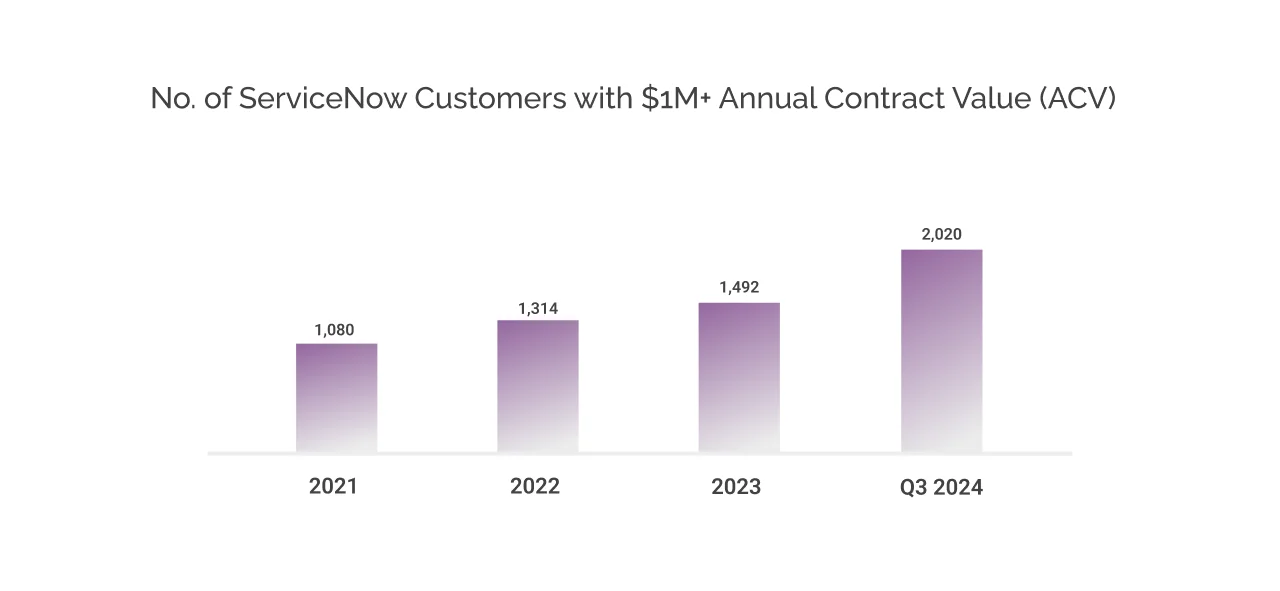
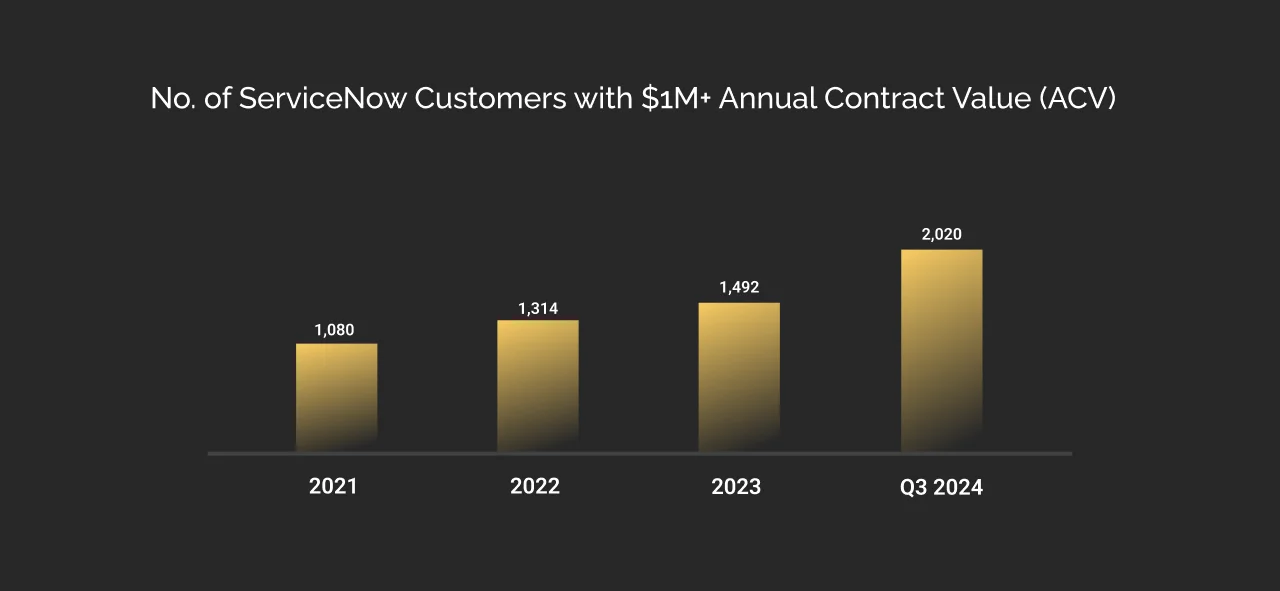
The number of ServiceNow’s biggest customers has grown by an average of 23%. This growth is expected to continue, ServiceNow is projected to have 3,066 customers with 1M+ ACV by 2026.
Frequently Asked Questions About ServiceNow Customers
1. How many Fortune 500 companies are using ServiceNow?
85% of the Fortune 500 companies are using ServiceNow including:
| Fortune 500 companies are using ServiceNow | ||
|---|---|---|
| Coca-Cola | Vodafone | American Express |
| Visa | DXC Technology | Delta Air Lines |
| BT Group | MGM Resorts International | Lenovo |
| AT&T | Nvidia | United Airlines |
| Lloyds Banking Group | Standard Chartered | SoftBank |
| Swiss Re | Dell Technologies | |
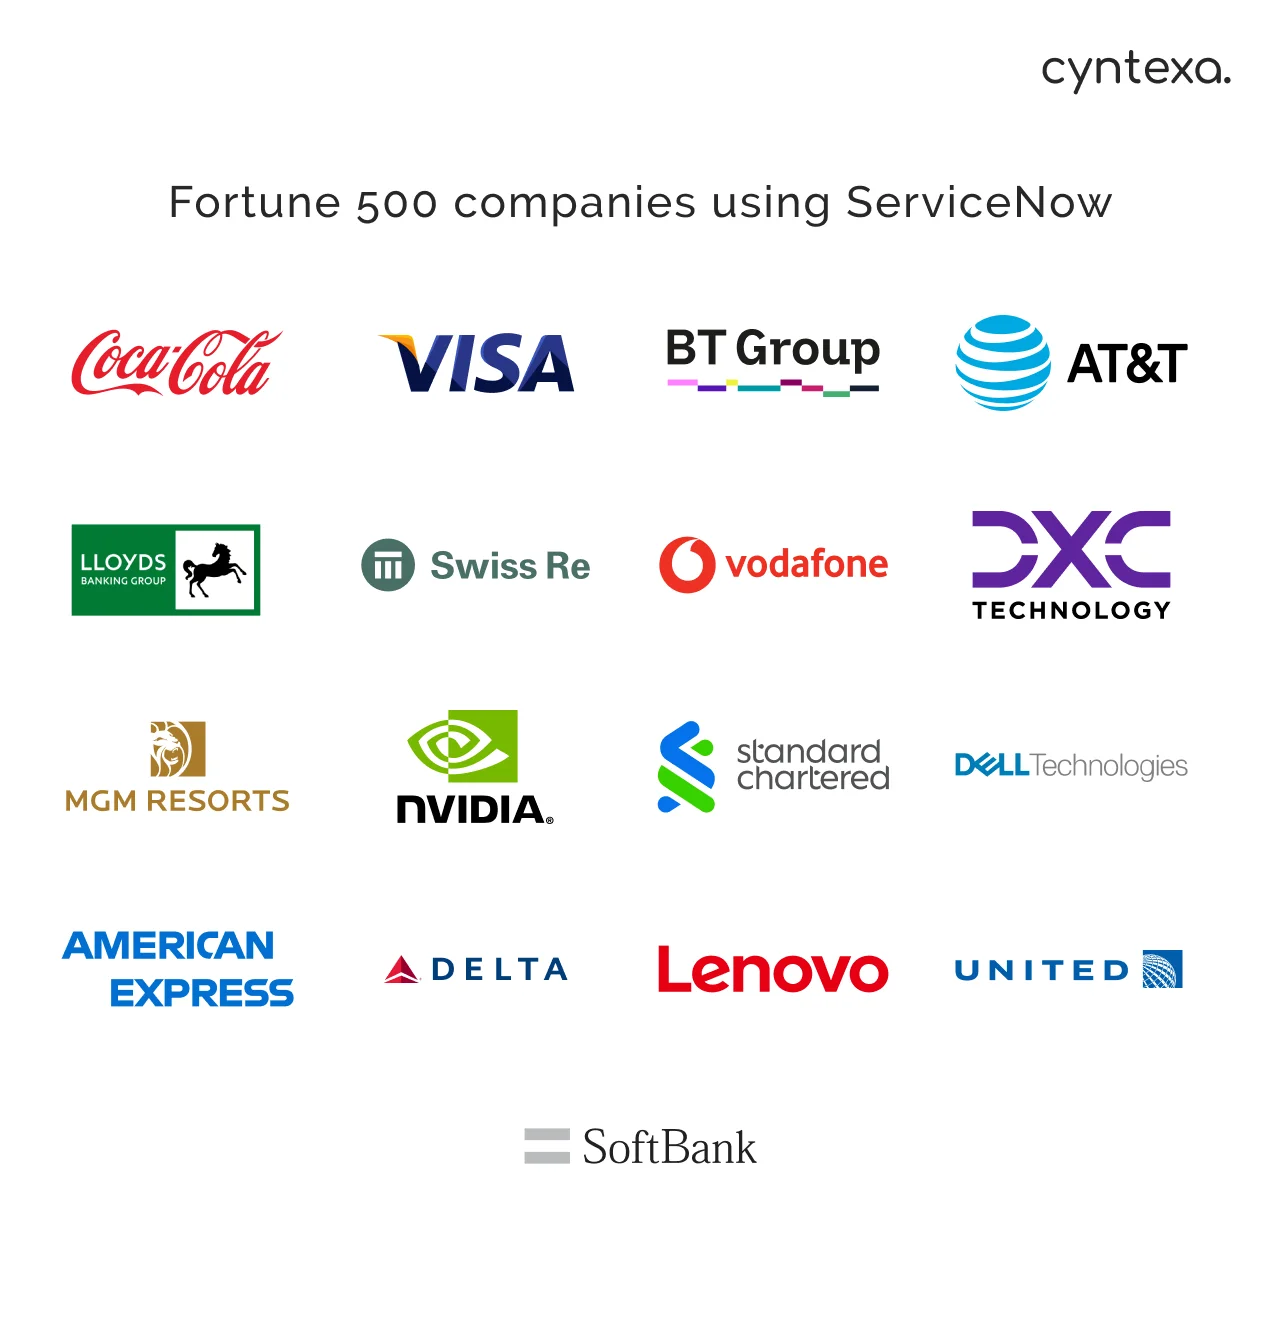
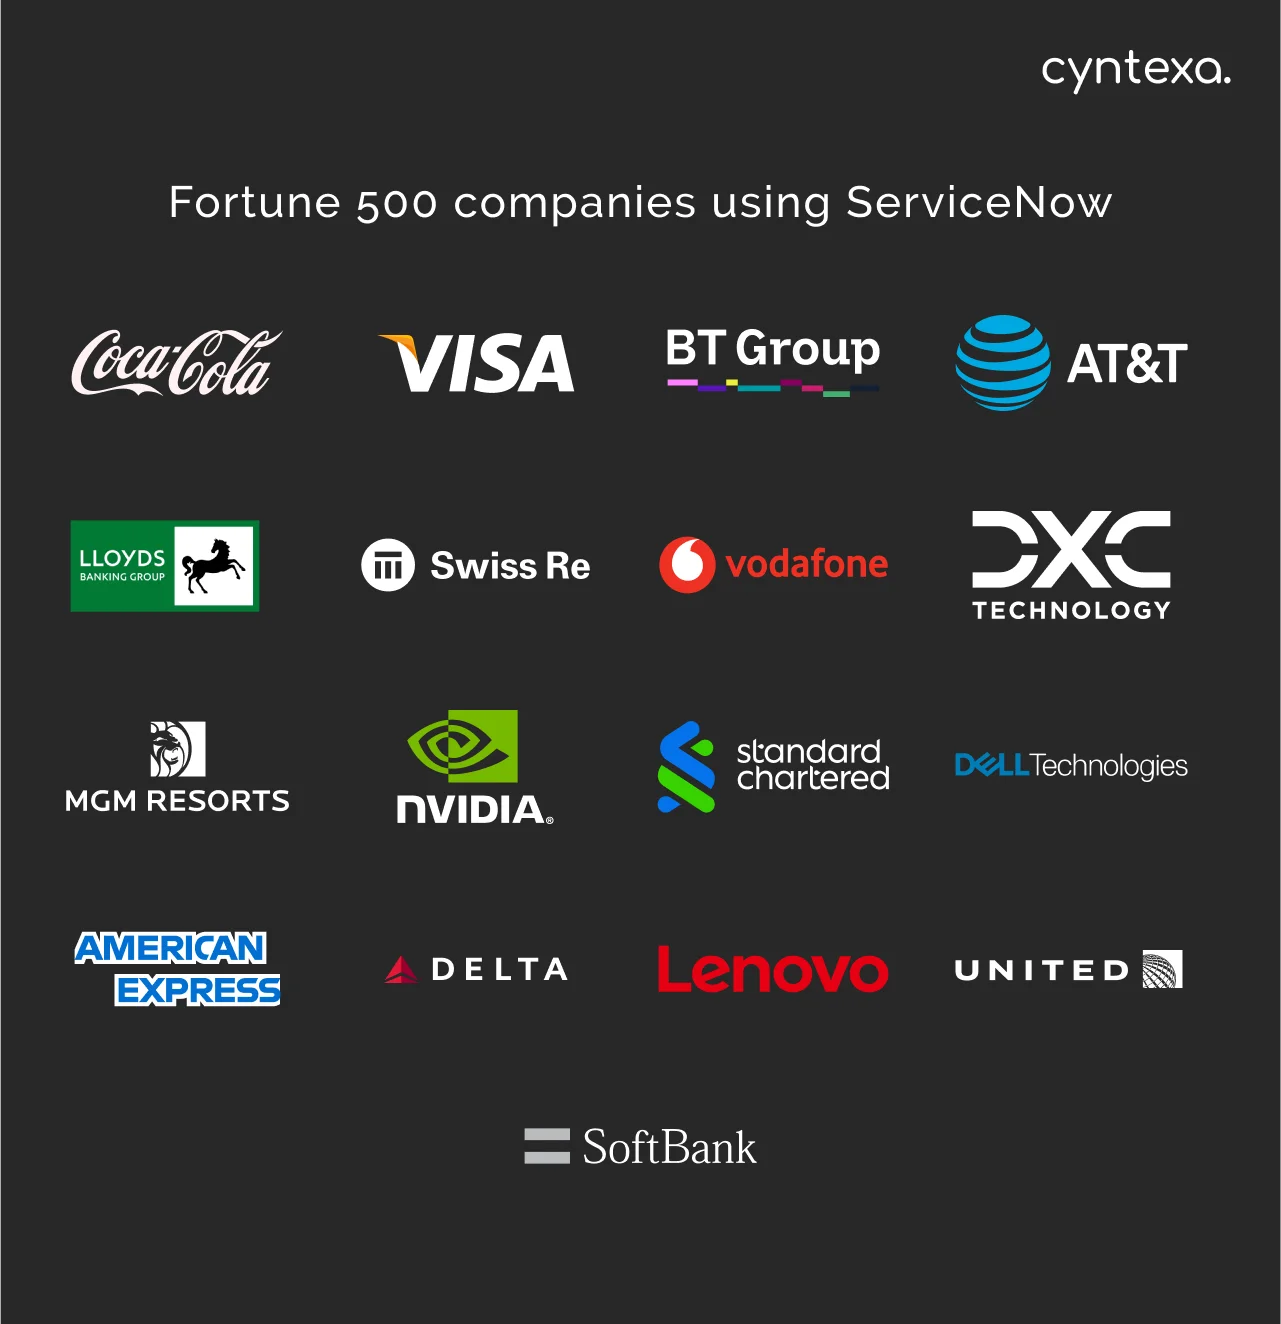
These are some of the Fortune 500 companies leveraging the capabilities of ServiceNow to make the world work.
2. List of companies using ServiceNow in the United States
Some of the world’s top companies using ServiceNow are headquartered in the United States. The North American region accounts for 63% of ServiceNow’s annual revenue in 2023. Here we have compiled a list of the companies using ServiceNow in the US:
| Companies using ServiceNow in the USA | |||
|---|---|---|---|
| Company Name | Headquarters | Industry | Products Used |
| Körber Supply Chain | Minneapolis, Minnesota | Technology | Customer Service Management IT Operations Management IT Service Management |
| Dropbox | San Francisco, California | Technology | Sourcing and Procurement Operations |
| Kraft Heinz | Chicago, Illinois | Consumer Goods | Customer Service Management |
| Epicor | Austin, Texas | Computer Software | Customer Service Management |
| American Seafoods | Seattle, Washington | Food & Beverages | Field Service Management IT Asset Management IT Service Management |
| Bridgewater Bank | Bloomington, Minnesota | Financial Services | Financial Services Operations Governance, Risk, and Compliance |
| Second Harvest Heartland | Brooklyn Park, Minnesota | Non-profit | Public Sector Digital Services |
| Xerox | Norwalk, Connecticut | Services Providers | Customer Service Management Field Service Management |
| Novant Health | Charlotte, North Carolina | Healthcare | IT Service Management Automation Engine Virtual Agent |
| Tennessee Dept of Human Services | Nashville, Tennessee | State Government | Legal Service Delivery |
| Fruit of the Loom, Inc. | Bowling Green, Kentucky | Apparel & Sporting Goods | IT Service Management |
| Wellstar Health System | Atlanta, Georgia | Healthcare | Vulnerability Response |
| Michael Best | Milwaukee, Wisconsin | Legal | App Engine IT Service Management |
| Florida Digital Service | Tallahassee, Florida | Government | Public Sector Digital Services |
3. What companies use ServiceNow in the United Kingdom (UK)?
| Companies using ServiceNow in the UK | |||
|---|---|---|---|
| Company Name | Headquarters | Industry | Products Used |
| AMS | Bracknell, UK | Workforce Solutions | Now Platform App Engine |
| Jigsaw24 | Nottingham, U.K. | Technology | Field Service Management Customer Service Management |
| Driver and Vehicle Standards Agency | Bristol, UK | Public Sector | IT Service Management Pro |
| RNIB | London, England | Nonprofit | Employee Center IT Service Management |
| Vodafone | Newbury, United Kingdom | Services | Now Platform Customer Service Management |
| Davies | London, UK | Financial Services | IT Asset Management IT Service Management ServiceNow Impact Software Asset Management Strategic Portfolio Management |
| Coca-Cola Europacific Partners | London, England | Consumer Packaged Goods | HR Service Delivery Safe Workplace |
4. What companies use ServiceNow in Canada?
| Companies using ServiceNow in Canada | |||
|---|---|---|---|
| Company Name | Headquarters | Industry | Products Used |
| Georgian College | Ontario, Canada | Higher Education | Automation Engine Customer Service Management IT Service Management |
| Acronym | Ontario, Canada | Information and Communications Technology | Telecommunications Service Management Telecommunications Service Operations Management Order Management for Telecommunications ServiceNow Impact |

5. List of companies using ServiceNow in India
| Companies using ServiceNow in the UK | |||
|---|---|---|---|
| Company Name | Headquarters | Industry | Products Used |
| Wipro Limited | India | Managed Service Provider | Governance, Risk, and Compliance IT Operations Management IT Service Management Professional Security Operations |
| LTIMindtree Ltd. | Mumbai, India | Technology | HR Service Delivery IT Service Management Strategic Portfolio Management |

6. What are the product-based companies using ServiceNow?
Product-based companies using ServiceNow include Amplifon, SES-imagotag, AMS, Premise Health, Syntax, and KOMSA.

ServiceNow Employee Count
ServiceNow Employee Count in 2025
As of Q4 2025 (January 28, 2026), ServiceNow employed 29,187 people across its global organization. Of these, 9,556 professionals are part of the research and development function alone, underscoring ServiceNow’s significant and ongoing investment in building, enhancing, and maintaining its platform.
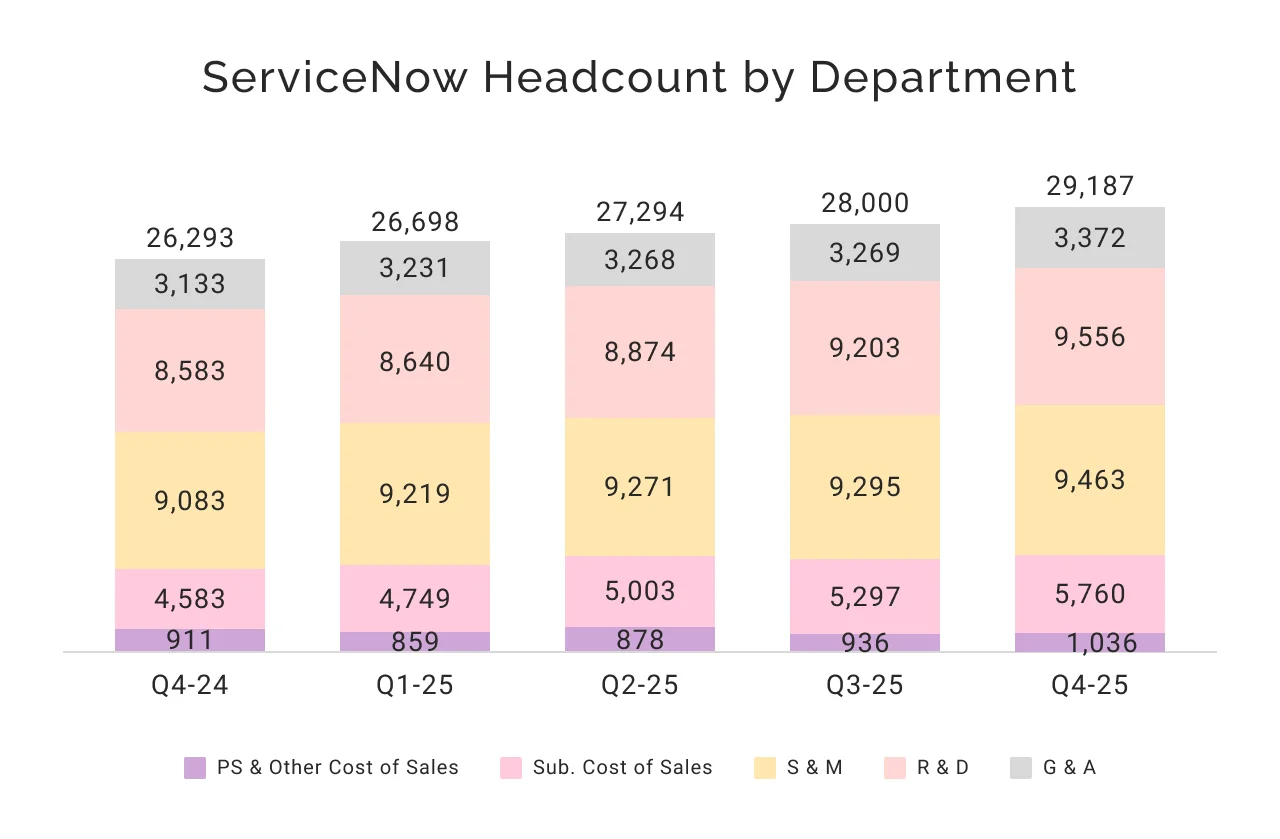
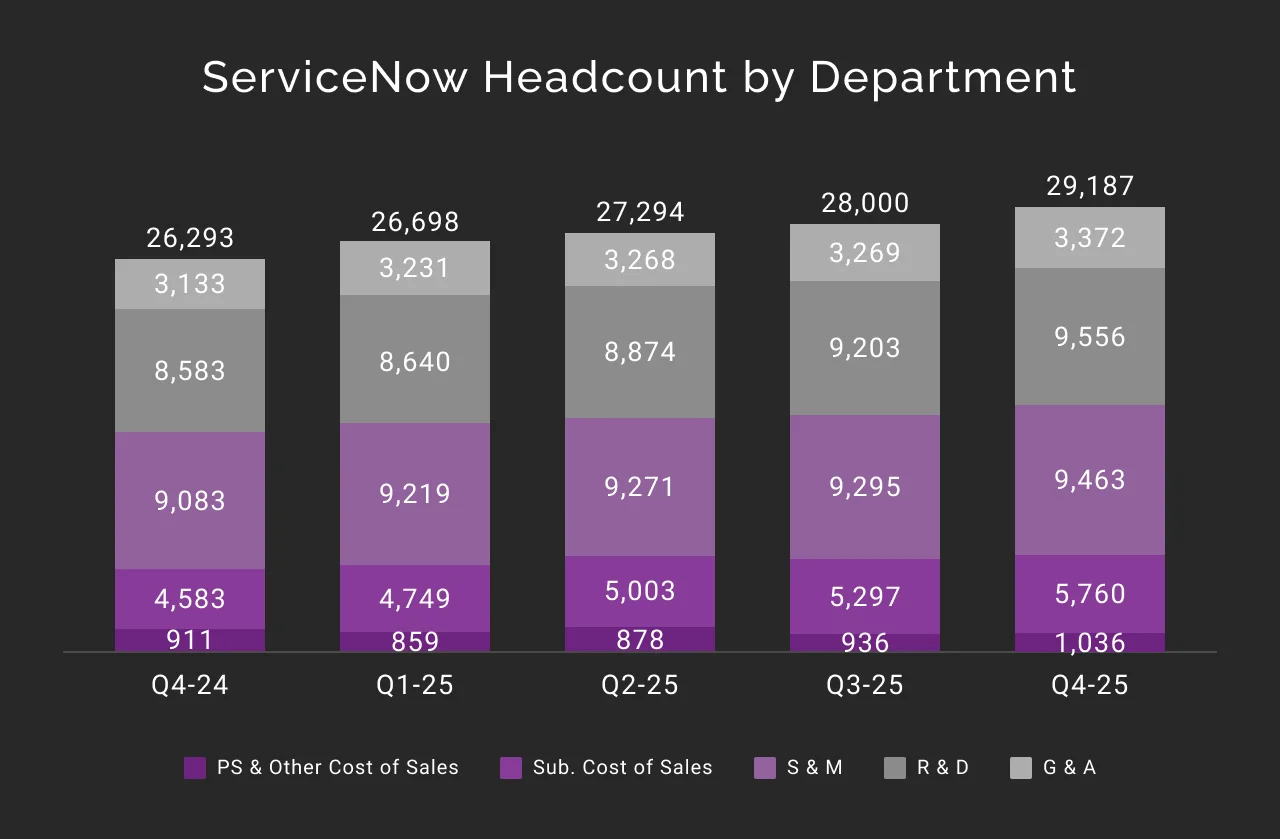
Image source: ServiceNow Q4 2025 investor presentation
ServiceNow Employee Count in 2024
As of December 31, 2024, ServiceNow had 26,293 employees, 3,625 higher than in 2023. ServiceNow is continually growing its employee base to drive new innovations and meet the needs of its growing number of customers.
ServiceNow Employee Count in 2023
As of December 2023, ServiceNow had 22,688 employees, of which 66.7% (approximately 15,131) are male, and 33.3% (approximately 7,557) are female. 54.9% of ServiceNow employees are based in the Americas, 27.2% in the APJ region, and 17.8% in the EMEA region.
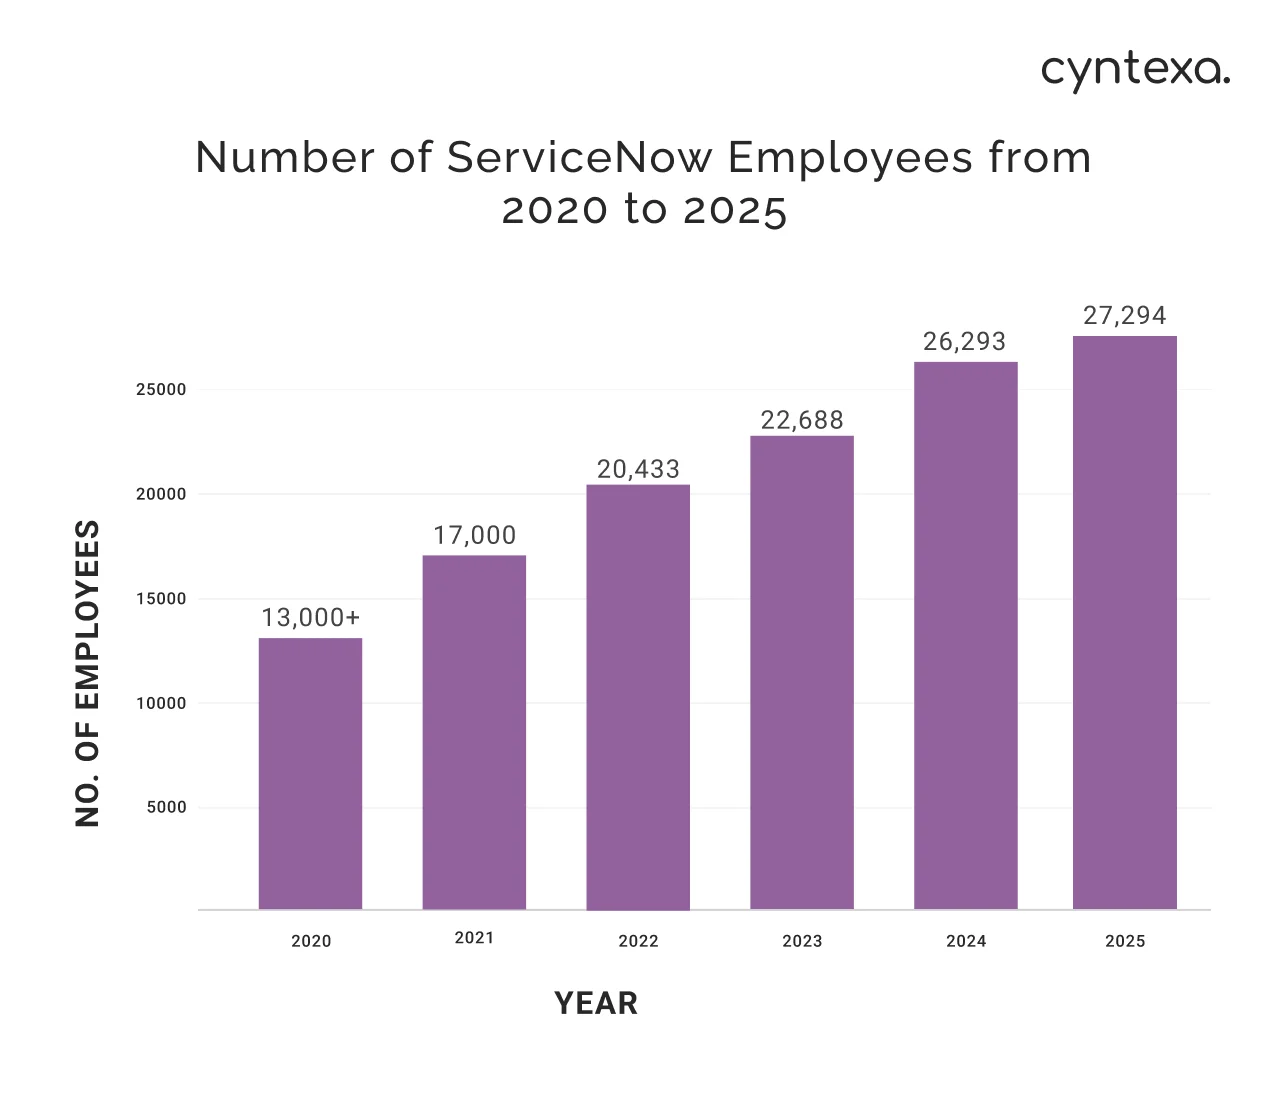
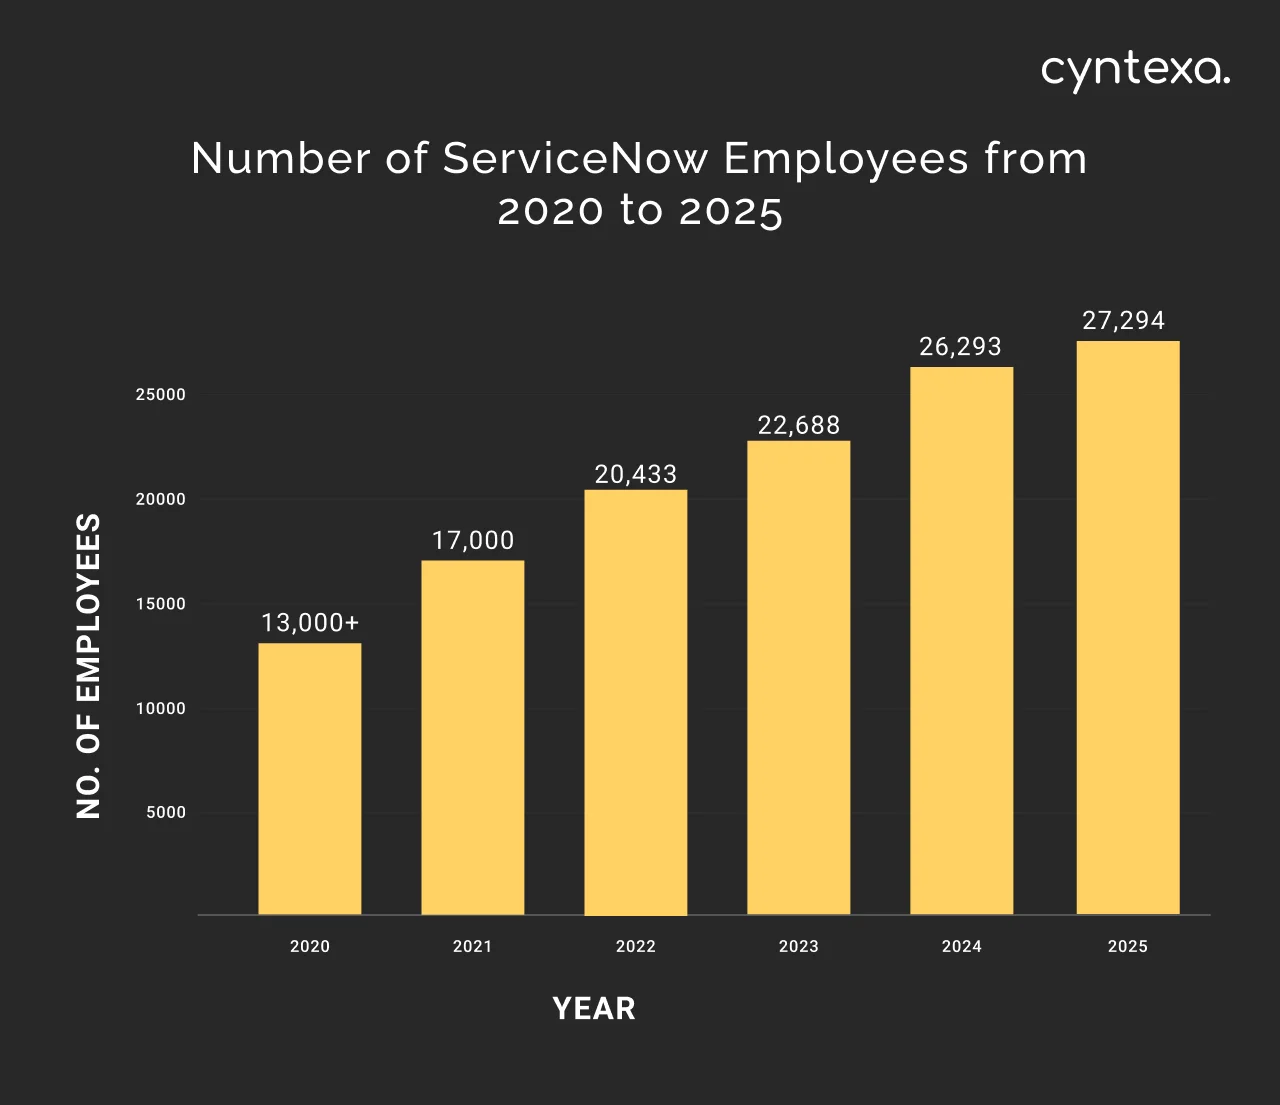
ServiceNow Employee Number From 2020 to 2025
The number of ServiceNow employees is continuously increasing thanks to the strong emphasis on attracting and retaining talent.
| ServiceNow No. of Employees from 2020 to 2023 | |
|---|---|
| Year | No. of Employees |
| 2020 | 13,000+ |
| 2021 | 17,000 |
| 2022 | 20,433 |
| 2023 | 22,688 |
| 2024 | 26,293 |
| 2025 | 27,294 |
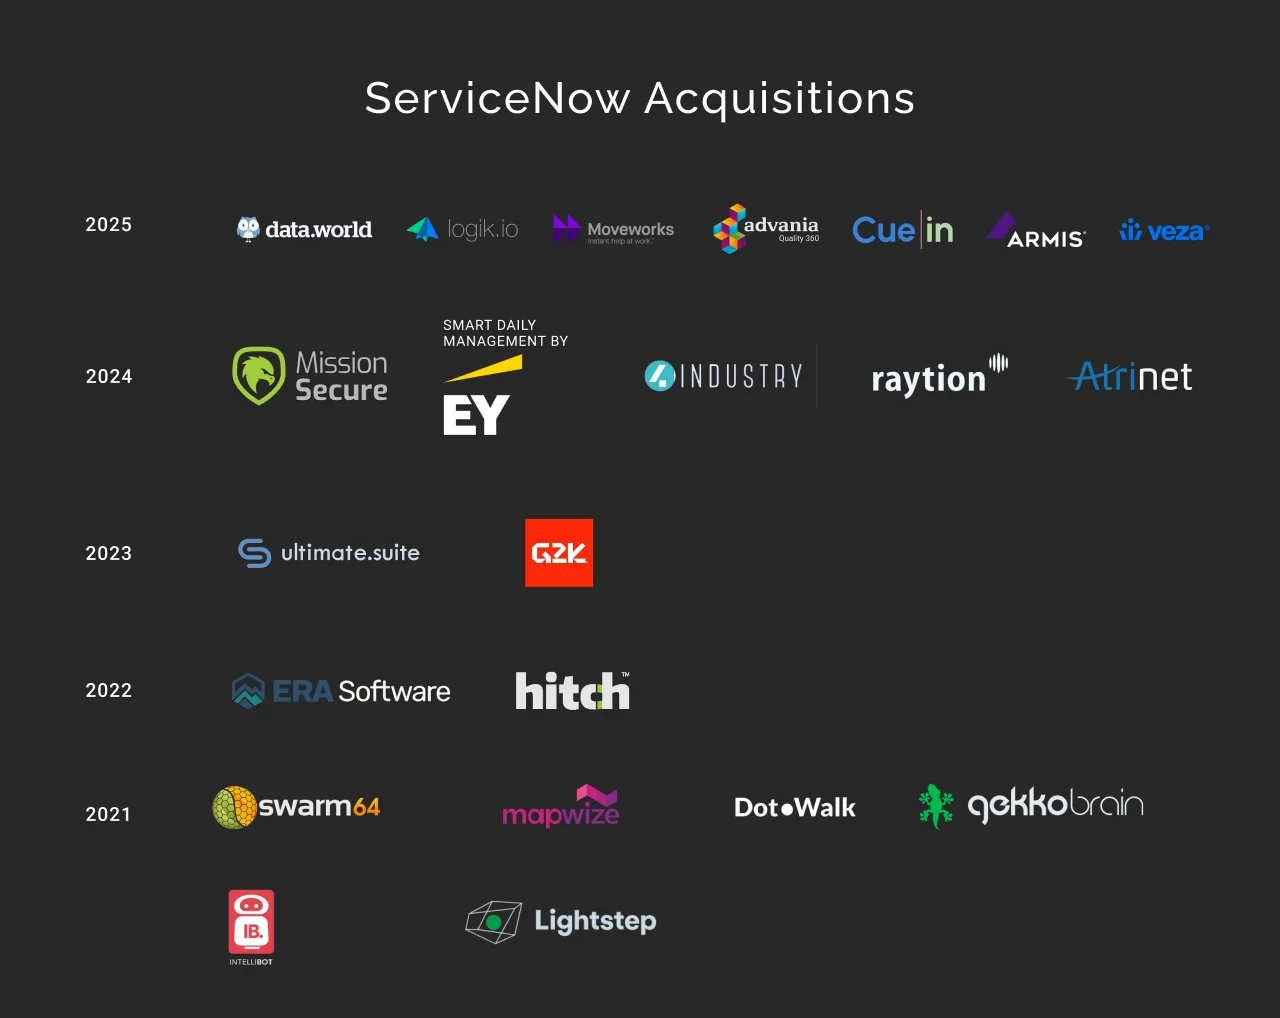
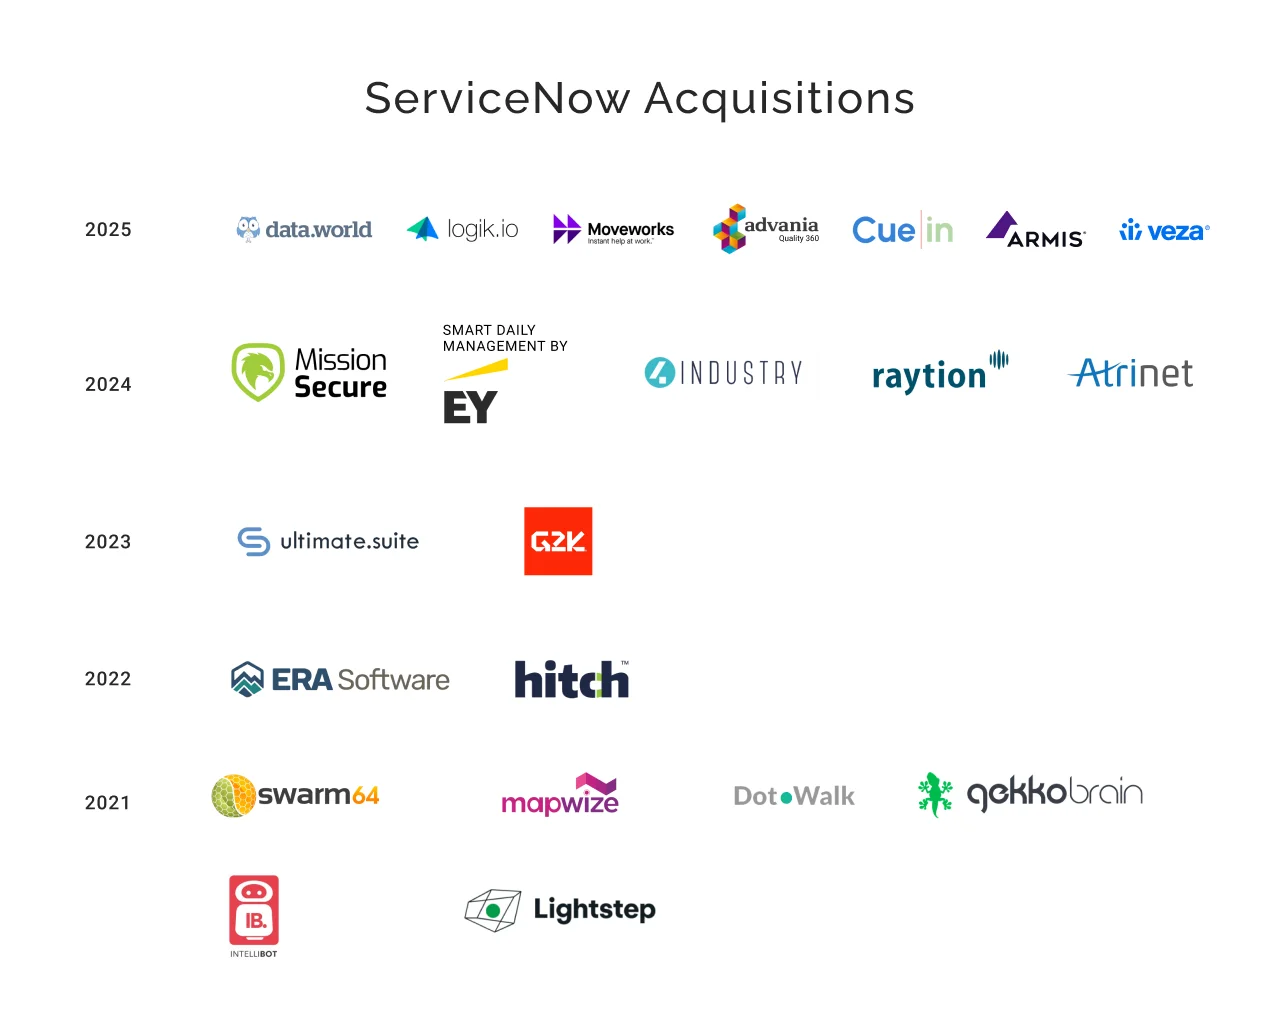
ServiceNow Acquisitions
ServiceNow is quite active in pursuing strategic acquisitions to broaden its portfolio of offerings. Here we have created a timeline of the ServiceNow acquisitions from 2021 to 2025.
For list of all ServiceNow acquisitions with analysis, refer our complete guide to ServiceNow acquisitions.


Final Take
ServiceNow, initially started as an IT service management platform, today serves Fortune 500 companies. Its portfolio of products and services is continually expanding to ensure the evolving enterprise’s requirements are taken care of.
Cyntexa is a ServiceNow Consulting & Implementation partner with a pool of ServiceNow experts having expertise across ITSM, ITOM, CSM, CSM, Now Platform, CMBD, and more. We’re working with all sizes of organizations to bridge the gap between their requirements, and ServiceNow platform capabilities to ensure successful digital transformation. From ServiceNow consulting services to implementation, integration, migration, and app development to managed services, we have the expertise to deliver the results that matter to you.
Additionally, we also offer IT Staff augmentation services allowing you to hire on-demand ServiceNow experts working with your existing team as an extension to achieve the results you strive for. Let’s connect to help us know your requirements, and how we can answer your requirements.
Don’t Worry, We Got You Covered!
Get The Expert curated eGuide straight to your inbox and get going with the Salesforce Excellence.
AUTHOR
Vishwajeet Srivastava
Salesforce Data Cloud, AI Products, ServiceNow, Product Engineering
Co-founder and CTO at Cyntexa also known as “VJ”. With 10+ years of experience and 22+ Salesforce certifications, he’s a seasoned expert in Salesforce Data Cloud & AI Products, Product Engineering, AWS, Google Cloud Platform, ServiceNow, and Managed Services. Known for blending strategic thinking with hands-on expertise, VJ is passionate about building scalable solutions that drive innovation, operational efficiency, and enterprise-wide transformation.


Cyntexa.
Join Our Newsletter. Get Your Daily Dose Of Search Know-How